. 2013 Dec;57(4):333-52.
doi: 10.1007/s10858-013-9791-1. Epub 2013 Oct 30.

Deriving quantitative dynamics information for proteins and RNAs using ROTDIF with a graphical user interface

Affiliations

Deriving quantitative dynamics information for proteins and RNAs using ROTDIF with a graphical user interface

Konstantin Berlin et al. J Biomol NMR. 2013 Dec.

Abstract

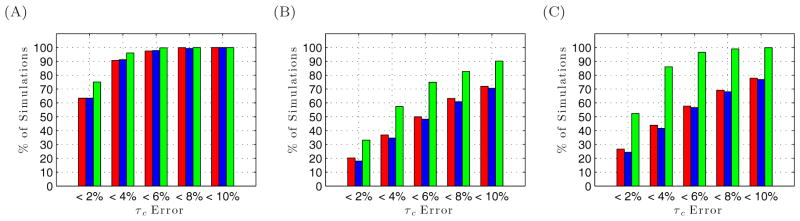
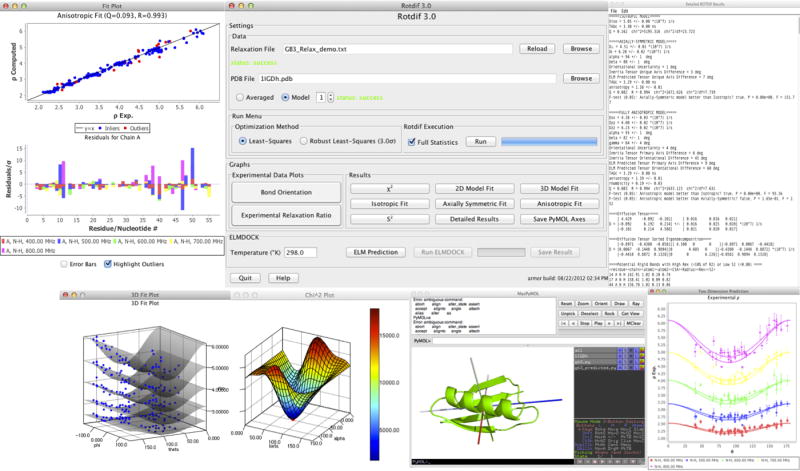
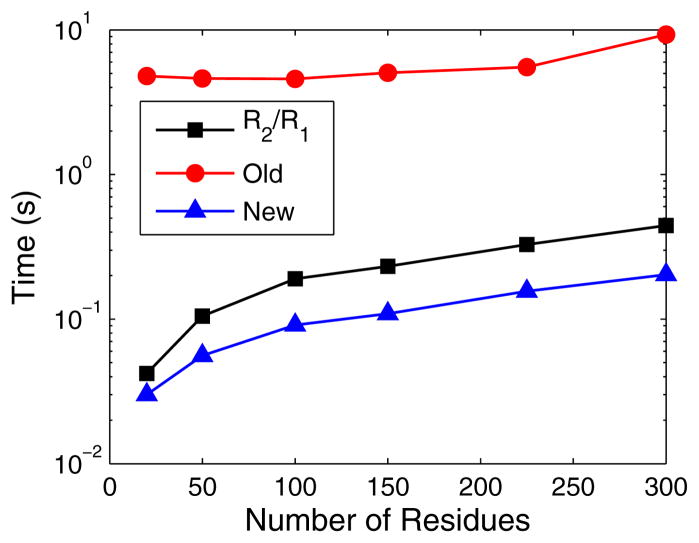
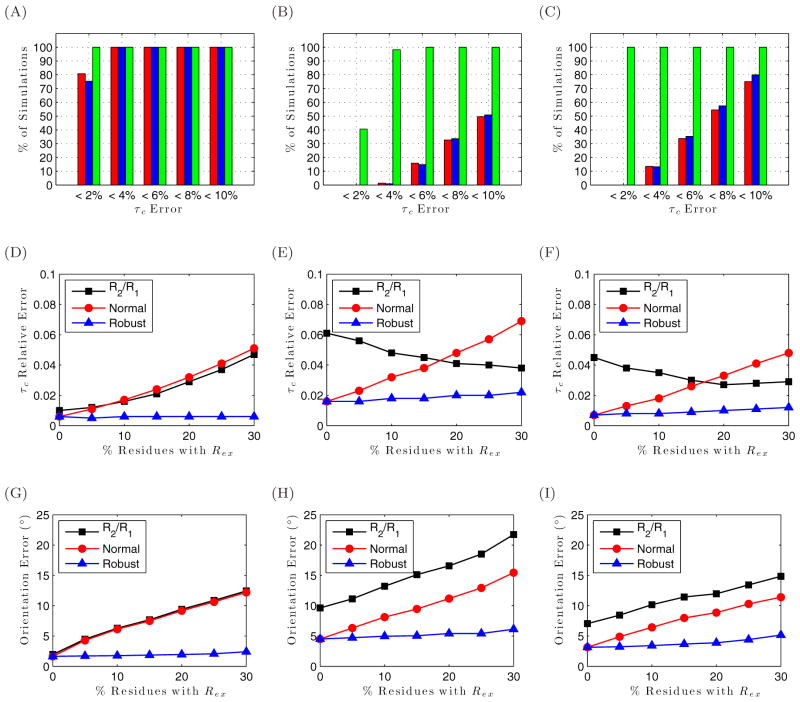
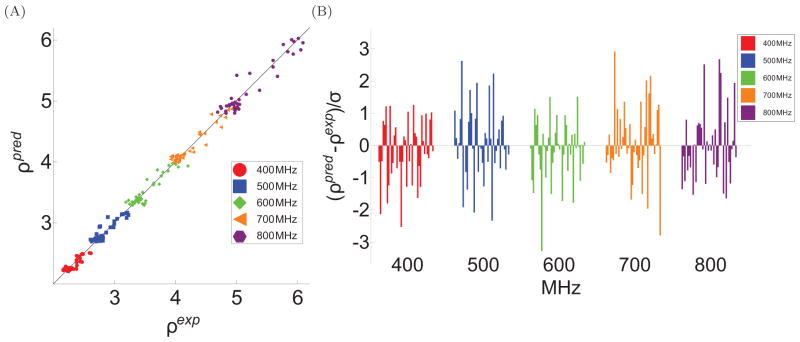
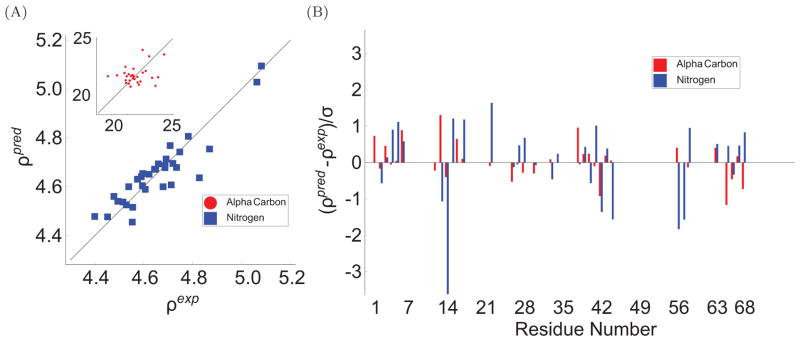
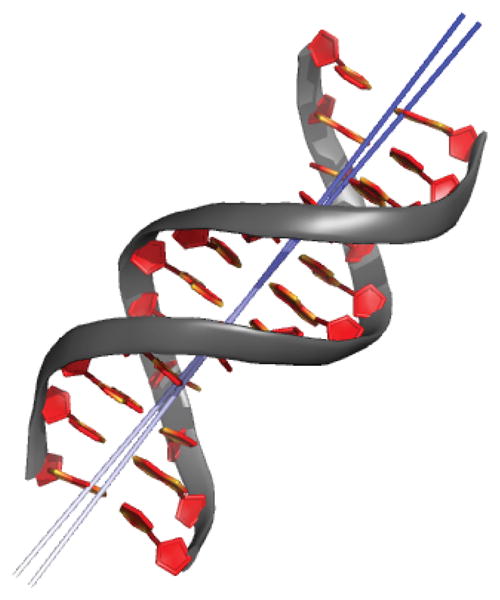
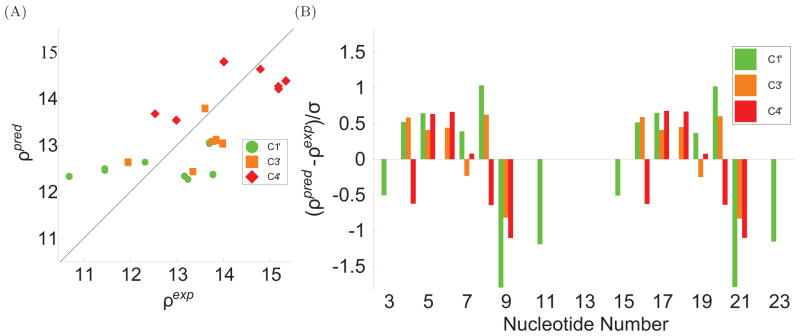
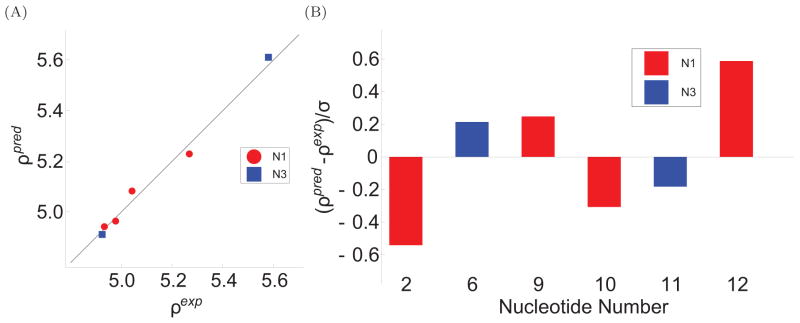
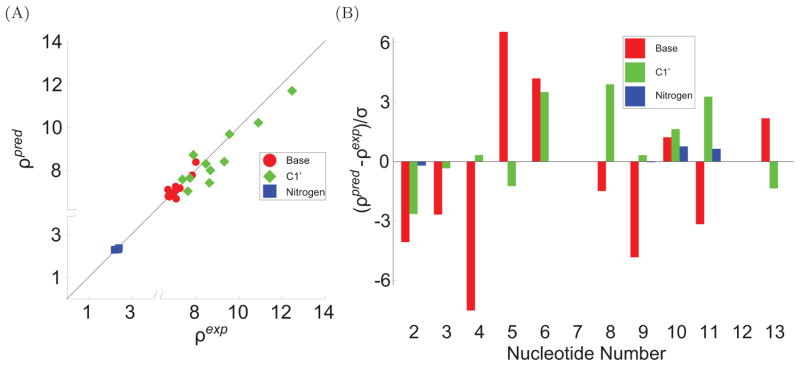
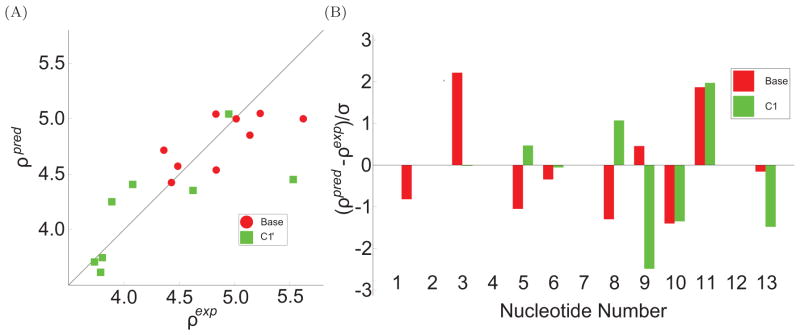
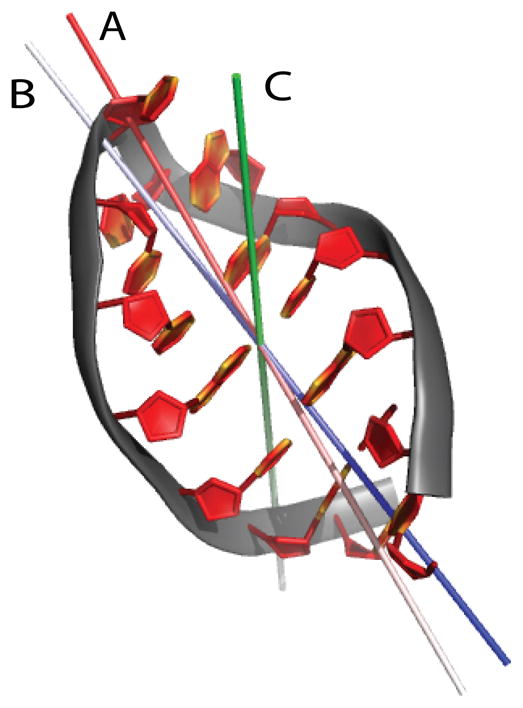
To facilitate rigorous analysis of molecular motions in proteins, DNA, and RNA, we present a new version of ROTDIF, a program for determining the overall rotational diffusion tensor from single- or multiple-field nuclear magnetic resonance relaxation data. We introduce four major features that expand the program's versatility and usability. The first feature is the ability to analyze, separately or together, (13)C and/or (15)N relaxation data collected at a single or multiple fields. A significant improvement in the accuracy compared to direct analysis of R2/R1 ratios, especially critical for analysis of (13)C relaxation data, is achieved by subtracting high-frequency contributions to relaxation rates. The second new feature is an improved method for computing the rotational diffusion tensor in the presence of biased errors, such as large conformational exchange contributions, that significantly enhances the accuracy of the computation. The third new feature is the integration of the domain alignment and docking module for relaxation-based structure determination of multi-domain systems. Finally, to improve accessibility to all the program features, we introduced a graphical user interface that simplifies and speeds up the analysis of the data. Written in Java, the new ROTDIF can run on virtually any computer platform. In addition, the new ROTDIF achieves an order of magnitude speedup over the previous version by implementing a more efficient deterministic minimization algorithm. We not only demonstrate the improvement in accuracy and speed of the new algorithm for synthetic and experimental (13)C and (15)N relaxation data for several proteins and nucleic acids, but also show that careful analysis required especially for characterizing RNA dynamics allowed us to uncover subtle conformational changes in RNA as a function of temperature that were opaque to previous analysis.


Figures

Fig. 1
Fig. 1
The percent of simulations, from 1000 independent runs, in which the relative error in the recovered τc was below the listed thresholds. The τc values were derived from the generated synthetic relaxation data using the following methods: direct analysis of the R2/R1 ratios (red bars, left) or analysis of the ρ values (Eq. (6)) with high-frequency contributions subtracted using known R3 values (green bars, right) or using predicted R3 values, assuming that the measured R3 values are not available (blue bars, middle). (A) The results for 15N in N-H bonds in a protein. (B) The results for 13C in C1′-H1′ bonds in RNA. (C) The results for 13C in C6-H6 bonds in RNA.
Fig. 2
Fig. 2
Demo screenshot of ROTDIF’s Graphical User Interface and an overlay of the rotational diffusion tensor axes onto a protein structure in PYMOL (DeLano, 2002) via a ROTDIF-generated script.
Fig. 3
Fig. 3
Timing results for computation of the anisotropic rotational diffusion tensor for randomly generated data of various sizes. The black line (squares) corresponds to direct analysis of R2/R1, achieved using our new deterministic initial sampling approach. The blue line (triangles) shows timing for the new deterministic high-frequency subtraction algorithm. The red line (circles) represents the previous version of ROTDIF, which uses a stochastic initial sampling algorithm. Note that both R2/R1 and ROTDIF 3 are implemented in Java, while the old ROTDIF runs in Matlab.
Fig. 4
Fig. 4
Simulation results for a set of 100 uniformly oriented PQ vectors, based on relaxation data for 15N in N-H bonds in a protein (left column), 13C in C1′-H1′ bonds in RNA (middle column), and 13C in C6-H6 bonds in RNA (right column). All simulations were performed for 1000 independent runs. (A–C) The percent of simulations in which the relative error in the recovered τc was below the listed thresholds, for isotropic diffusion tensor model. The τc values were computed using the following methods: direct analysis of the R2/R1 ratios (red bars) or analysis of the ρ values with high-frequency contributions subtracted using known R3 values (green bars) or using predicted R3 values, assuming that the measured R3 values are not available (blue bars). (D–I) Errors in the computed diffusion tensor (Dpred) relative to the input tensor (Dexp) for the anisotropic diffusion tensor model (Dx = 1 × 10⁻⁷ s−1, Dy = 2 × 10⁻⁷ s−1, Dz = 3 × 10⁻⁷ s−1). The x-axis shows the percentage of residues with Rex > 0. Shown are errors in the magnitude (D–F) and orientation (G–I) of the tensor.
Fig. 5
Fig. 5
The agreement between the experimental and back-calculated 15N relaxation data for GB3 at five magnetic fields for the fully anisotropic diffusion tensor model. (A) The correlation plot of the experimental vs. back-calculated ρ values. (B) Fit residuals for individual residues, scaled by their associated standard deviations.
Fig. 6
Fig. 6
Combined fit of the 15N and 13C (inset) relaxation data for the core residues in ubiquitin to the fully anisotropic diffusion tensor model. (A) The agreement between the experimental and back-calculated ρ values. (B) The residuals of fit for individual residues, scaled by their associated standard deviations.
Fig. 7
Fig. 7
The principal axes (z) corresponding to the Dz component of the determined (axially-symmetric) and ELM-predicted rotational diffusion tensors, overlaid on top of the cartoon representation of the Dickerson DNA dodecamer, d(CGCGAATTCGCG)2. There is a 1° difference in the orientation of the two axes. The PyMOL script for drawing the axes was automatically generated by ROTDIF.
Fig. 8
Fig. 8
The fit of the 13C relaxation data for the Dickerson DNA dodecamer using the axially-symmetric diffusion tensor model. (A) The agreement between the experimental and back-calculated ρ values. (B) The residuals of fit, scaled by their associated standard deviations.
Fig. 9
Fig. 9
The fit of the 15N relaxation data from the Akke et al. dataset (Akke et al, 1997) for the core nucleotides in cUUCGg tetraloop to the axially-symmetric diffusion tensor model. (A) The agreement between the experimental and back-calculated ρ values. (B) The residuals of fit, scaled by their associated standard deviations.
Fig. 10
Fig. 10
Simultaneous fit of the 15N and 13C relaxation data from the Duchardt et al. dataset (Duchardt and Schwalbe, 2005) for the core nucleotides in cUUCGg tetraloop to the fully anisotropic diffusion tensor model. (A) The agreement between the experimental and back-calculated ρ values. (B) The residuals of fit scaled by their associated standard deviations.
Fig. 11
Fig. 11
The fit of the 13C relaxation data from the Ferner et al. dataset (Ferner et al, 2008) for the core nucleotides in cUUCGg tetraloop to the axially-symmetric diffusion tensor model. (A) The agreement between the experimental and back-calculated ρ values. (B) The residuals of fit scaled by their associated standard deviations.
Fig. 12
Fig. 12
The principal Dz axes of the anisotropic tensors from ELM prediction (A, red) and derived from Duchardt et al. (B, blue), and Ferner et al. (C, green) datasets, overlaid on top of the cartoon of cUUCGg. The PyMOL script for drawing the axes was automatically generated by ROTDIF 3.

References

    1. Akke M, Fiala R, Jiang F, Patel D, Palmer A. Base dynamics in a UUCG tetraloop RNA hairpin characterized by 15N spin relaxation: correlations with structure and stability. RNA. 1997;3(7):702–709. - PMC - PubMed
    1. Berlin K, O’Leary DP, Fushman D. Improvement and analysis of computational methods for prediction of residual dipolar couplings. Journal of Magnetic Resonance. 2009;201(1):25–33. - PMC - PubMed
    1. Berlin K, O’Leary DP, Fushman Structural assembly of molecular complexes based on residual dipolar couplings. Journal of American Chemical Society. 2010;132(26):8961–8972. - PMC - PubMed
    1. Berlin K, O’Leary DP, Fushman D. Fast approximations of the rotational diffusion tensor and their application to structural assembly of molecular complexes. Proteins: Structure, Function, and Bioinformatics. 2011;79(7):2268–2281. - PMC - PubMed
    1. Blackledge M, Cordier F, Dosset P, Marion D. Precision and uncertainty in the characterization of anisotropic rotational diffusion by 15N relaxation. Journal of the American Chemical Society. 1998;120(18):4538–4539.

Publication types

LinkOut - more resources