

WISECONDOR: detection of fetal aberrations from shallow sequencing maternal plasma based on a within-sample comparison scheme
- PMID: 24170809
- PMCID: PMC3950725
- DOI: 10.1093/nar/gkt992
WISECONDOR: detection of fetal aberrations from shallow sequencing maternal plasma based on a within-sample comparison scheme
Abstract
Genetic disorders can be detected by prenatal diagnosis using Chorionic Villus Sampling, but the 1:100 chance to result in miscarriage restricts the use to fetuses that are suspected to have an aberration. Detection of trisomy 21 cases noninvasively is now possible owing to the upswing of next-generation sequencing (NGS) because a small percentage of fetal DNA is present in maternal plasma. However, detecting other trisomies and smaller aberrations can only be realized using high-coverage NGS, making it too expensive for routine practice. We present a method, WISECONDOR (WIthin-SamplE COpy Number aberration DetectOR), which detects small aberrations using low-coverage NGS. The increased detection resolution was achieved by comparing read counts within the tested sample of each genomic region with regions on other chromosomes that behave similarly in control samples. This within-sample comparison avoids the need to re-sequence control samples. WISECONDOR correctly identified all T13, T18 and T21 cases while coverages were as low as 0.15-1.66. No false positives were identified. Moreover, WISECONDOR also identified smaller aberrations, down to 20 Mb, such as del(13)(q12.3q14.3), +i(12)(p10) and i(18)(q10). This shows that prevalent fetal copy number aberrations can be detected accurately and affordably by shallow sequencing maternal plasma. WISECONDOR is available at bioinformatics.tudelft.nl/wisecondor.
Figures


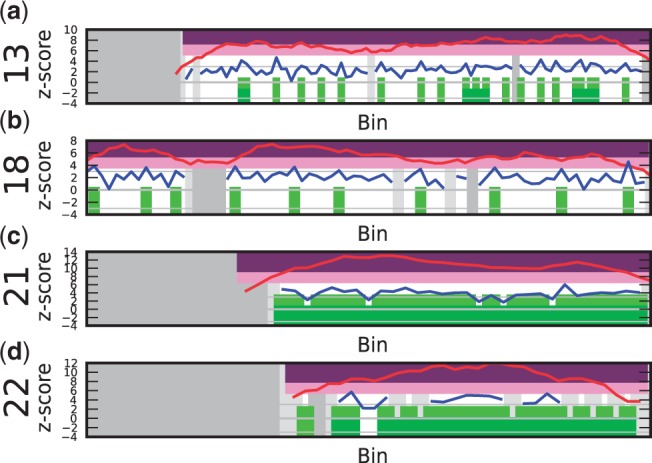
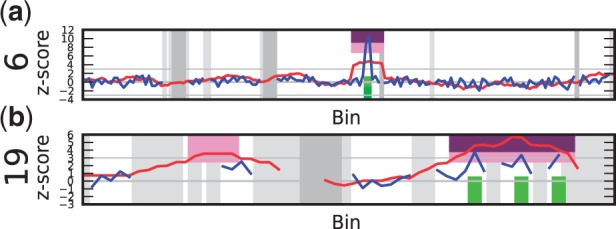
 ). Purple regions show bins called by WISECONDOR (i.e. the sliding window approach). Dark green regions mark bins called with the individual bin method. Light green and pink regions are bins found deviating, by the individual bin and sliding window approach respectively, but those are too small in width such as spikes (and thus did not pass WISECONDOR’s minimum size requirement). Horizontal gray lines denote the abs(z) = 3 threshold. Gray regions are uncallable regions, where light gray is caused by being unable to find enough reference bins and dark gray regions are bins containing mostly unmappable (repetitive) sequences. (a) Sample A5: Trisomy 13. (b) Sample A9: Trisomy 18. (c) Sample A11: Trisomy 21. (d) Sample C18: Trisomy 22.
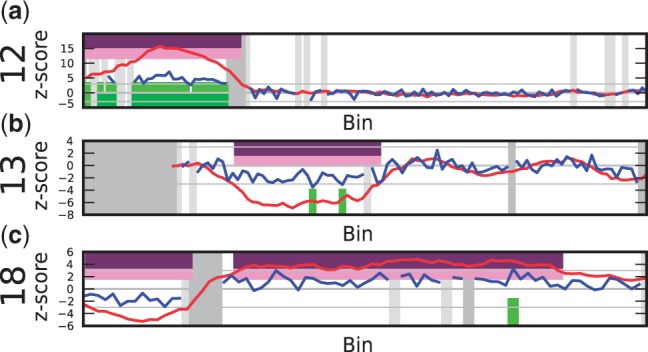
References
-
- Tabor A, Philip J, Madsen M, Bang J, Obel E, Nrgaard-Pedersen B. Randomised controlled trial of genetic amniocentesis in 4606 low-risk women. Lancet. 1986;1:1287–1293. - PubMed
-
- Lo Y, Corbetta N, Chamberlain P, Rai V, Sargent I, Redman C, Wainscoat J. Presence of fetal DNA in maternal plasma and serum. Lancet. 1997;350:485–487. - PubMed
-
- Lo Y, Chan K, Sun H, Chen E, Jiang P, Lun F, Zheng Y, Leung T, Lau T, Cantor C, et al. Maternal plasma DNA sequencing reveals the genome-wide genetic and mutational profile of the fetus. Sci. Trans. Med. 2010;2 61ra91. - PubMed
Publication types
MeSH terms
Substances
LinkOut - more resources
Full Text Sources
Other Literature Sources
Medical
Miscellaneous
