. 2014 Mar;42(5):e30.
doi: 10.1093/nar/gkt972. Epub 2013 Oct 28.

A fluorescence-based assay suitable for quantitative analysis of deadenylase enzyme activity

Affiliations

A fluorescence-based assay suitable for quantitative analysis of deadenylase enzyme activity

Maryati Maryati et al. Nucleic Acids Res. 2014 Mar.

Abstract

In eukaryotic cells, the shortening and removal of the poly(A) tail of cytoplasmic mRNA by deadenylase enzymes is a critical step in post-transcriptional gene regulation. The ribonuclease activity of deadenylase enzymes is attributed to either a DEDD (Asp-Glu-Asp-Asp) or an endonuclease-exonuclease-phosphatase domain. Both domains require the presence of two Mg2+ ions in the active site. To facilitate the biochemical analysis of deadenylase enzymes, we have developed a fluorescence-based deadenylase assay. The assay is based on end-point measurement, suitable for quantitative analysis and can be adapted for 96- and 384-well microplate formats. We demonstrate the utility of the assay by screening a chemical compound library, resulting in the identification of non-nucleoside inhibitors of the Caf1/CNOT7 enzyme, a catalytic subunit of the Ccr4-Not deadenylase complex. These compounds may be useful tools for the biochemical analysis of the Caf1/CNOT7 deadenylase subunit of the Ccr4-Not complex and indicate the feasibility of developing selective inhibitors of deadenylase enzymes using the fluorescence-based assay.


Figures

Figure 1.
Figure 1.
Principle of the fluorescence-based deadenylase assay. (A) Schematic diagram of the fluorescence-based deadenylase assay. The assay is based on a 5′ Flc-labelled RNA oligonucleotide substrate. After incubation of the substrate in the presence of a deadenylase enzyme, the reaction is stopped and a 3′ TAMRA-labelled DNA oligonucleotide probe complementary to the RNA substrate is added. Flc fluorescence of intact substrate is quenched upon probe hybridization because of the close proximity of the TAMRA fluorophore. In contrast, the TAMRA-labelled probe cannot hybridize to the Flc-labelled reaction product allowing detection of Flc fluorescence. (B) Purified enzymes used for assay development. Wild-type Caf1/CNOT7 and inactive Caf1/CNOT7 containing the amino acid substitution D40A were expressed as His-tagged proteins in E. coli and purified using immobilized-metal affinity chromatography. Purified proteins (3 µg) were separated by 12% SDS–PAGE and stained with coomassie. (C) Gel-based deadenylase assay. Equal amounts of wild-type and inactive Caf1/CNOT7 (0.4 µM) were incubated with 5′ Flc-labelled substrate (1 µM). After incubation (60 min), the substrate RNA was subjected to denaturing PAGE and visualized using epifluorescence. Indicated are the intact RNA substrates containing nine 3′ adenylate residues (A9) and the 8-mer reaction product containing a single 3′ adenylate residue (A1). (D) Fluorescence-based measurement of deadenylase activity. The indicated amount of wild-type and inactive (D40A) Caf1/CNOT7 protein was incubated with Flc-labelled substrate (1 µM). After incubation (60 min), a 5-fold molar excess of the 3′ TAMRA-labelled probe was added before fluorescence was measured. (E) Measurement of fluorescence as a function of time. Wild-type and inactive D40A Caf1/CNOT7 (0.4 µM) were incubated with Flc-labelled substrate (1 µM). After the indicated time, a 5-fold molar excess of the 3′ TAMRA-labelled probe was added before fluorescence was measured. Error bars indicate the standard error of the mean (n = 3).
Figure 2.
Figure 2.
Quantitative analysis of Caf1/CNOT7 enzyme kinetics. (A) Measurement of fluorescence as a function of time using the indicated oligonucleotide substrate concentrations. Reactions contained 0.4 µM Caf1/CNOT7 enzyme. Error bars indicate the standard error of the mean (n = 3). Fluorescence was normalized by subtraction of background fluorescence observed in the absence of enzyme. (B) Kinetic data from panel (A) were plotted to estimate the Km by curve fitting of the Michaelis–Menten equation (Km = 10.6 ± 2.9 µM). The inset shows the Lineweaver–Burk plot of the kinetic data from panel (A). Curve fitting was carried out using Graphpad Prism. Error bars indicate the standard error of the mean.
Figure 3.
Figure 3.
Identification of small molecule inhibitors of Caf1/CNOT7 using a fluorescence-based deadenylase assay. (A) Evaluation of the fluorescence-based deadenylase assay for screening by Z factor analysis. The mean value of the Z factor is 0.88 ± 0.02 (n = 4). (B) Screening of a library of 1440 compounds. The compounds were dispensed in five 384-well plates and pre-incubated with Caf1/CNOT7 enzyme for 15 min at room temperature. After addition of RNA substrate (final concentration: 0.4 µM Caf1/CNOT7 enzyme, 100 µM library compound, 1.0 µM substrate in a reaction volume of 20 µl), reactions were incubated for 60 min. Reactions were stopped by the addition of 20 µl of a solution containing 1.0% SDS and a 5-fold molar excess of probe. Dots indicate fluorescence of each well containing a library compound. Also indicated is the mean background fluorescence (solid line). Dotted lines indicate three standard deviations from the mean of reactions containing library compounds or of the mean background fluorescence, respectively.
Figure 4.
Figure 4.
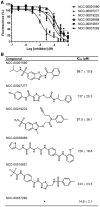
Determination of IC50 values of small-molecule inhibitors of Caf1/CNOT7. (A) Determination of IC50 values. Compounds were pre-incubated with Caf1/CNOT7 for 15 min at room temperature, followed by the addition of RNA substrate. After incubation (60 min at 30°C), reactions were stopped by the addition of SDS and a 5-fold molar excess of probe. Shown are representative experiments. Error bars indicate the standard error of the mean. (B) Structures of inhibitors with IC50 values <250 µM. The chemical structure of NCC-00037292 will be reported elsewhere. The IC50 values shown (± standard error of the mean) are derived from at least three independent replicate experiments.
Figure 5.
Figure 5.
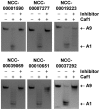
Validation of inhibitory activity using gel-based product analysis. The indicated compounds (NCC-00001590, NCC-00007277, NCC-00019223, NCC-00039069, NCC-00010651, 300 µM; NCC-00037292, 100 µM, final concentration) were incubated with purified Caf1/CNOT7 enzyme (0.4 µM) and the 5′ Flc-labelled oligonucleotide substrate (1.0 µM). After incubation (30°C for 60 min), reactions were inactivated by heating. Products were separated by denaturing PAGE and directly visualized by epifluorescence. Indicated are the intact RNA substrates containing nine 3′ adenylate residues (A9) and the 8-mer reaction product containing a single 3′ adenylate residue (A1).
Figure 6.
Figure 6.
Selective inhibition of the Caf1/CNOT7 deadenylase. The activity of the Caf1/CNOT7, Ccr4/CNOT6L and PARN deadenylase enzymes was assessed in the presence of 300 µM (final concentration) of compound (A) NCC-00001590, (B) NCC-00007277, (C) NCC-00019223, (D) NCC-00039069, (E) NCC-00010651 and (F) NCC-00037292 (100 µM). Enzymes were pre-incubated with the indicated compounds at room temperature for 15 min. After addition of Flc-labelled substrate RNA, reactions were incubated at 30°C for 60 min. Fluorescence was measured after addition of a mixture containing SDS (0.5% final concentration) and a 5-fold molar excess of TAMRA-labelled probe. Error bars indicate the standard error of the mean (n = 3).
Figure 7.
Figure 7.
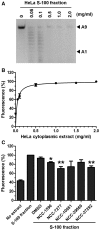
Fluorescence-based detection of 3′ exonuclease activity in complex mixtures. (A) Gel-based assay. Increasing amounts of a HeLa S-100 cytoplasmic extract was incubated with 5′ Flc-labelled substrate (1 µM). After incubation (60 min), the substrate RNA was subjected to denaturing PAGE and visualized using epifluorescence. Indicated are the intact RNA substrates containing nine 3′ adenylate residues (A9) and the deadenylated product (A1). (B) Fluorescence-based measurement of exonuclease activity. The indicated amount of HeLa S-100 fraction was incubated with Flc-labelled substrate (1 µM). After incubation (60 min), a 5-fold molar excess of the 3′ TAMRA-labelled probe was added before fluorescence was measured. (C) The activity of the S-100 fraction was assessed in the presence of NCC-00001590, NCC-00007277, NCC-00019223, NCC-00039069 and NCC-00010651 (300 µM) or NCC-00037292 (100 µM). *P < 0.05, **P < 0.01. Error bars indicate the standard error of the mean (n = 3).

References

    1. Garneau NL, Wilusz J, Wilusz CJ. The highways and byways of mRNA decay. Nat. Rev. Mol. Cell Biol. 2007;8:113–126. - PubMed
    1. Goldstrohm AC, Wickens M. Multifunctional deadenylase complexes diversify mRNA control. Nat. Rev. Mol Cell Biol. 2008;9:337–344. - PubMed
    1. Parker R, Song H. The enzymes and control of eukaryotic mRNA turnover. Nat. Struct. Mol. Biol. 2004;11:121–127. - PubMed
    1. Wahle E, Winkler GS. RNA decay machines: Deadenylation by the Ccr4-Not and Pan2-Pan3 complexes. Biochim. Biophys. Acta. 2013;1829:561–570. - PubMed
    1. Godwin AR, Kojima S, Green CB, Wilusz J. Kiss your tail goodbye: The role of PARN, Nocturnin, and Angel deadenylases in mRNA biology. Biochim. Biophys. Acta. 2013;1829:571–579. - PMC - PubMed

Publication types

MeSH terms