

An organ culture system to model early degenerative changes of the intervertebral disc II: profiling global gene expression changes
- PMID: 24171898
- PMCID: PMC3978582
- DOI: 10.1186/ar4301
An organ culture system to model early degenerative changes of the intervertebral disc II: profiling global gene expression changes
Abstract
Introduction: Despite many advances in our understanding of the molecular basis of disc degeneration, there remains a paucity of preclinical models which can be used to study the biochemical and molecular events that drive disc degeneration, and the effects of potential therapeutic interventions. The goal of this study is to characterize global gene expression changes in a disc organ culture system that mimics early nontraumatic disc degeneration.
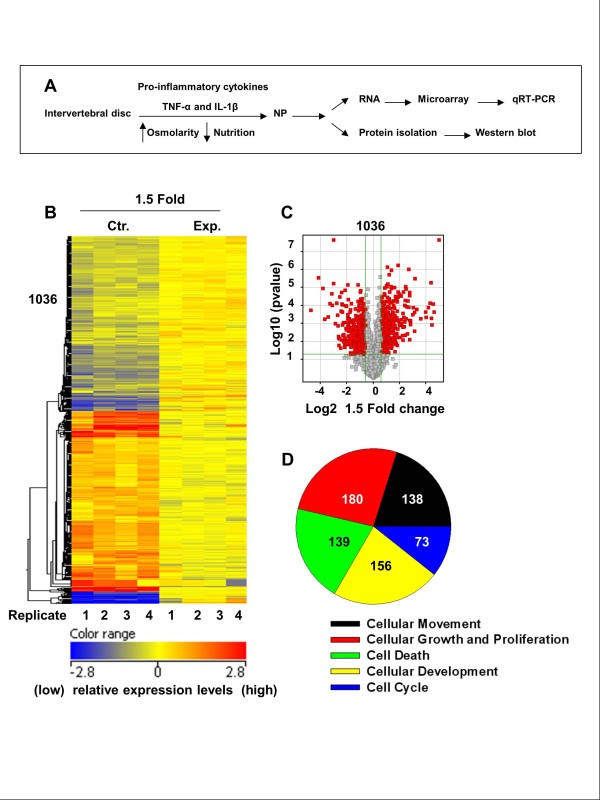
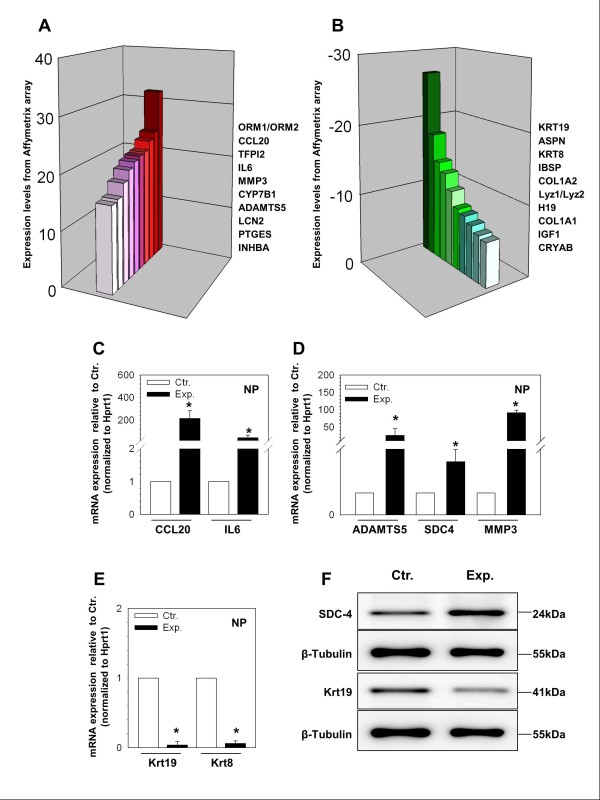
Methods: To mimic a degenerative insult, rat intervertebral discs were cultured in the presence of TNF-α, IL-1β and serum-limiting conditions. Gene expression analysis was performed using a microarray to identify differential gene expression between experimental and control groups. Differential pattern of gene expression was confirmed using quantitative reverse transcriptase polymerase chain reaction (qRT-PCR) or Western blot.
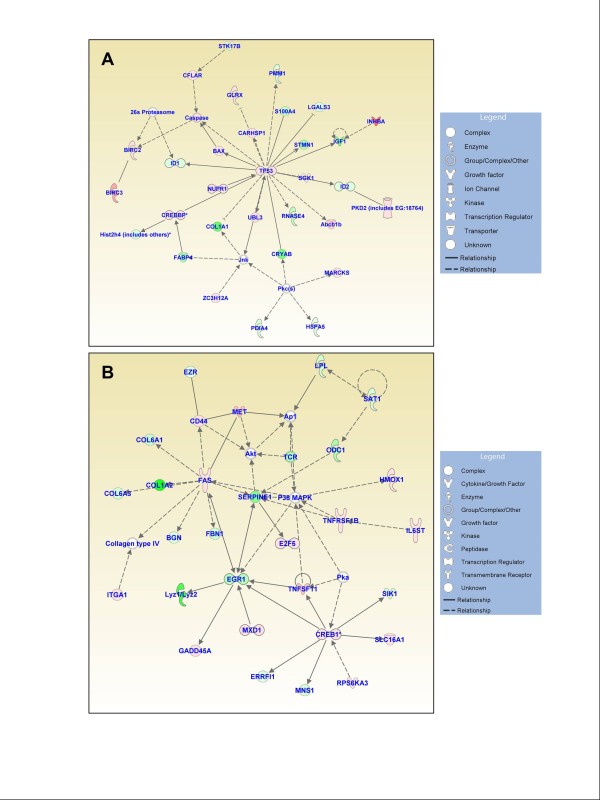
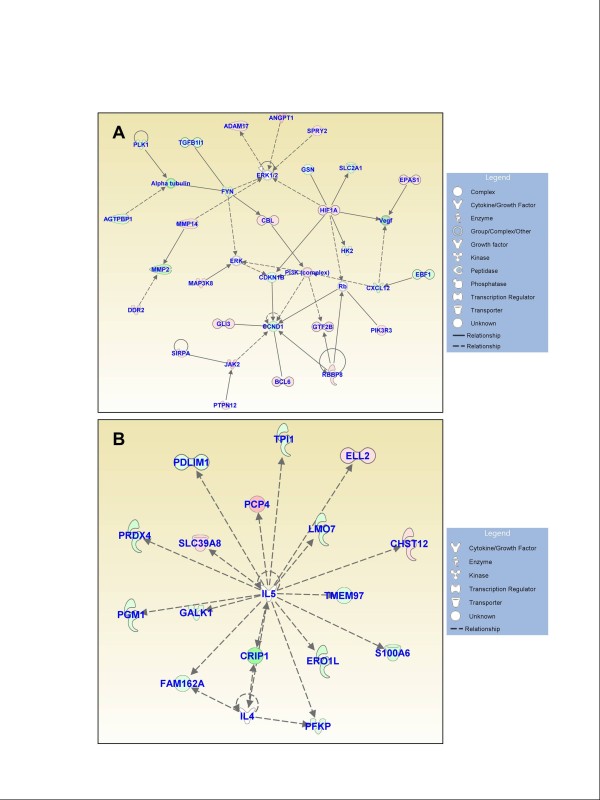
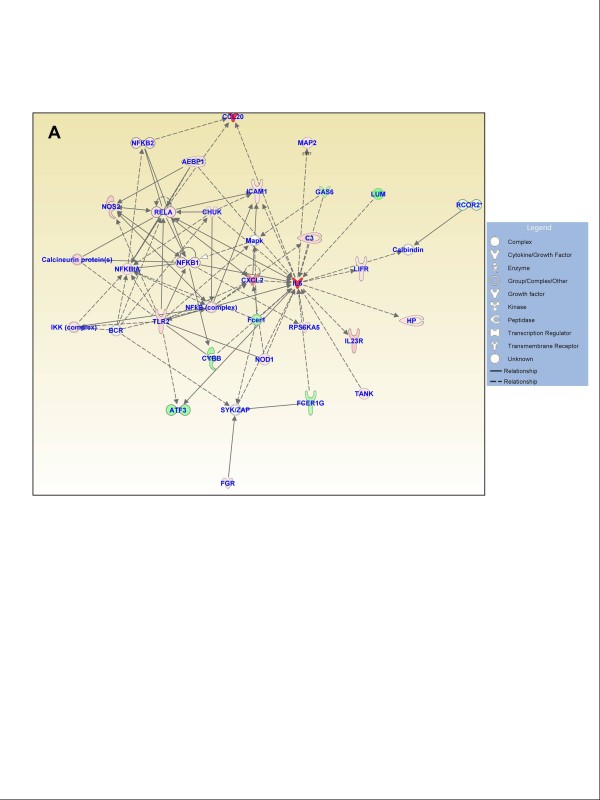
Results: Treatment resulted in significant changes in expression of more than 1,000 genes affecting many aspects of cell function including cellular movement, the cell cycle, cellular development, and cell death and proliferation. Many of the most highly upregulated and downregulated genes have known functions in disc degeneration and extracellular matrix hemostasis. Construction of gene networks based on known cellular pathways and expression data from our analysis demonstrated that the network associated with cell death, cell cycle regulation and DNA replication and repair was most heavily affected in this model of disc degeneration.
Conclusions: This rat organ culture model uses cytokine exposure to induce wide gene expression changes with the most affected genes having known reported functions in disc degeneration. We propose that this model is a valuable tool to study the etiology of disc degeneration and evaluate potential therapeutic treatments.
Figures
Similar articles
-
An organ culture system to model early degenerative changes of the intervertebral disc.Arthritis Res Ther. 2011;13(5):R171. doi: 10.1186/ar3494. Epub 2011 Oct 21. Arthritis Res Ther. 2011. PMID: 22018279 Free PMC article.
-
Expression and relationship of proinflammatory chemokine RANTES/CCL5 and cytokine IL-1β in painful human intervertebral discs.Spine (Phila Pa 1976). 2013 May 15;38(11):873-80. doi: 10.1097/BRS.0b013e318285ae08. Spine (Phila Pa 1976). 2013. PMID: 23660804
-
Identification of cellular senescence-related genes and immune cell infiltration characteristics in intervertebral disc degeneration.Front Immunol. 2024 Sep 12;15:1439976. doi: 10.3389/fimmu.2024.1439976. eCollection 2024. Front Immunol. 2024. PMID: 39328407 Free PMC article.
-
Disc in flames: Roles of TNF-α and IL-1β in intervertebral disc degeneration.Eur Cell Mater. 2015 Sep 21;30:104-16; discussion 116-7. doi: 10.22203/ecm.v030a08. Eur Cell Mater. 2015. PMID: 26388614 Free PMC article. Review.
-
The role of IL-1β and TNF-α in intervertebral disc degeneration.Biomed Pharmacother. 2020 Nov;131:110660. doi: 10.1016/j.biopha.2020.110660. Epub 2020 Aug 24. Biomed Pharmacother. 2020. PMID: 32853910 Review.
Cited by
-
Protocol for parallel proteomic and metabolomic analysis of mouse intervertebral disc tissues.JOR Spine. 2020 Jun 10;3(3):e1099. doi: 10.1002/jsp2.1099. eCollection 2020 Sep. JOR Spine. 2020. PMID: 33015574 Free PMC article.
-
Differential Carbonyl Stress Expression in the Intervertebral Disc between Singular- and Persistent-Mechanical Injuries.Nagoya Gakuin Daigaku Ronshu Igaku Kenko Kagaku Supotsu Kagakuhen. 2017;5(2):11-19. Nagoya Gakuin Daigaku Ronshu Igaku Kenko Kagaku Supotsu Kagakuhen. 2017. PMID: 28642835 Free PMC article.
-
TNFα transport induced by dynamic loading alters biomechanics of intact intervertebral discs.PLoS One. 2015 Mar 3;10(3):e0118358. doi: 10.1371/journal.pone.0118358. eCollection 2015. PLoS One. 2015. PMID: 25734788 Free PMC article.
-
Identification of critical genes in nucleus pulposus cells isolated from degenerated intervertebral discs using bioinformatics analysis.Mol Med Rep. 2017 Jul;16(1):553-564. doi: 10.3892/mmr.2017.6662. Epub 2017 May 31. Mol Med Rep. 2017. PMID: 28586059 Free PMC article.
-
Cellular senescence and other age-related mechanisms in skeletal diseases.Bone Res. 2025 Jul 7;13(1):68. doi: 10.1038/s41413-025-00448-7. Bone Res. 2025. PMID: 40623977 Free PMC article. Review.
References
-
- Kuslich SD, Ulstrom CL, Michael CJ. The tissue origin of low back pain and sciatica: areport of pain response to tissue stimulation during operations on the lumbar spine using local anesthesia. Orthop Clin North Am. 1991;15:181–187. - PubMed
-
- The Burden of Musculoskeletal Diseases in the United States. http://www.boneandjointburden.org
-
- Katz JN. Lumbar disc disorders and low-back pain: socioeconomic factors and consequences. J Bone Joint Surg Am. 2006. pp. 21–24. - PubMed
Publication types
MeSH terms
Substances
Grants and funding
LinkOut - more resources
Full Text Sources
Other Literature Sources
Molecular Biology Databases
