. 2014 Jan;52(1):147-55.
doi: 10.1128/JCM.02680-13. Epub 2013 Oct 30.

Genotypic and epidemiologic trends of norovirus outbreaks in the United States, 2009 to 2013

Affiliations

Genotypic and epidemiologic trends of norovirus outbreaks in the United States, 2009 to 2013

Everardo Vega et al. J Clin Microbiol. 2014 Jan.

Abstract

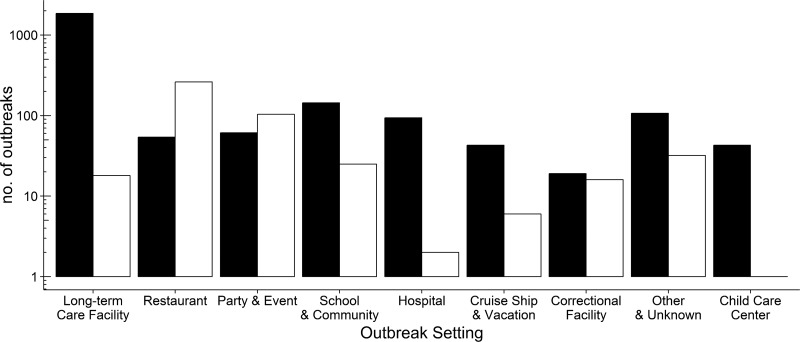
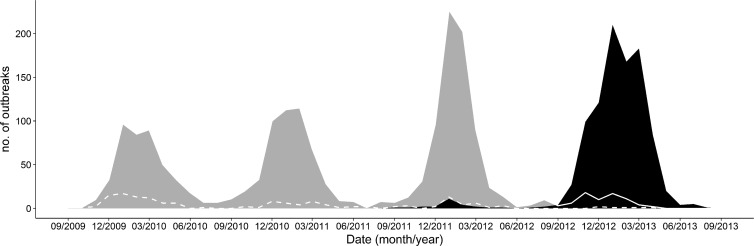
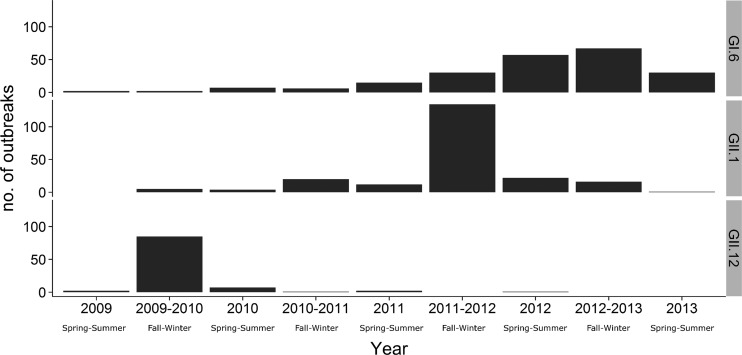
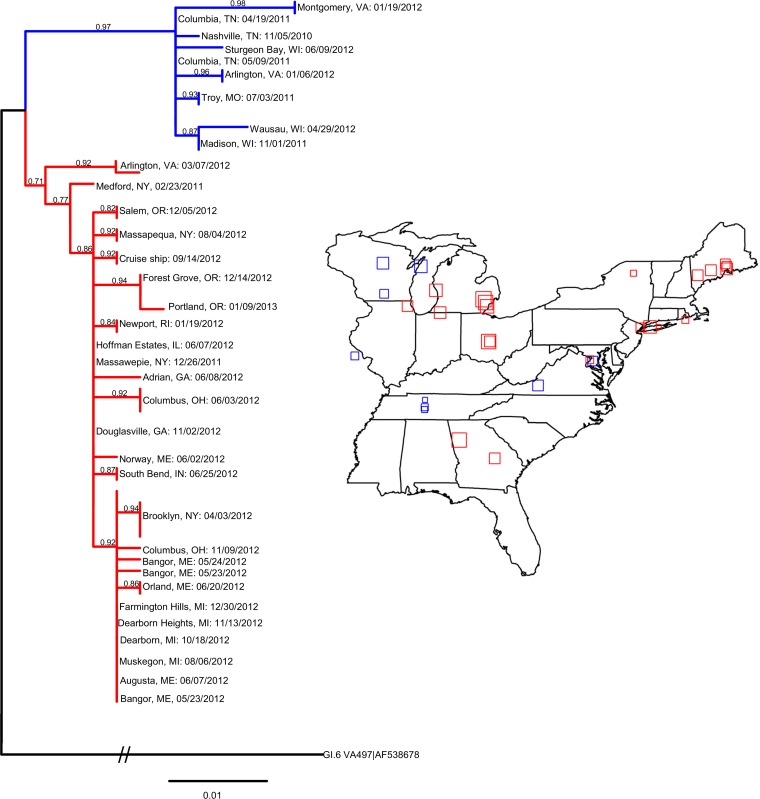
Noroviruses are the leading cause of epidemic acute gastroenteritis in the United States. From September 2009 through August 2013, 3,960 norovirus outbreaks were reported to CaliciNet. Of the 2,895 outbreaks with a known transmission route, person-to-person and food-borne transmissions were reported for 2,425 (83.7%) and 465 (16.1%) of the outbreaks, respectively. A total of 2,475 outbreaks (62.5%) occurred in long-term care facilities (LTCF), 389 (9.8%) in restaurants, and 227 (5.7%) in schools. A total of 435 outbreaks (11%) were typed as genogroup I (GI) and 3,525 (89%) as GII noroviruses. GII.4 viruses caused 2,853 (72%) of all outbreaks, of which 94% typed as either GII.4 New Orleans or GII.4 Sydney. In addition, three non-GII.4 viruses, i.e., GII.12, GII.1, and GI.6, caused 528 (13%) of all outbreaks. Several non-GII.4 genotypes (GI.3, GI.6, GI.7, GII.3, GII.6, and GII.12) were significantly more associated with food-borne transmission (odds ratio, 1.9 to 7.1; P < 0.05). Patients in LTCF and people ≥65 years of age were at higher risk for GII.4 infections than those in other settings and with other genotypes (P < 0.05). Phylogeographic analysis identified three major dispersions from two geographic locations that were responsible for the GI.6 outbreaks from 2011 to 2013. In conclusion, our data demonstrate the cyclic emergence of new (non-GII.4) norovirus strains, and several genotypes are more often associated with food-borne outbreaks. These surveillance data can be used to improve viral food-borne surveillance and to help guide studies to develop and evaluate targeted prevention methods such as norovirus vaccines, antivirals, and environmental decontamination methods.


Figures

FIG 1
FIG 1
Norovirus outbreaks by setting and transmission route. The numbers of norovirus outbreaks in different settings are shown for food-borne (□) and person-to-person (■) transmissions.
FIG 2
FIG 2
Distribution of norovirus GII.4 variants from September 2009 through August 2013. Area graphs represent GII.4 Sydney 2012 (black) and GII.4 New Orleans 2009 (gray). The lines track GII.4 Den Haag 2006b (dashed line) from 2009 to 2012 and GII.4 New Orleans 2009 (solid line) from September 2012 through August 2013.
FIG 3
FIG 3
Norovirus GII.12, GII.1, and GI.6 outbreaks reported to CaliciNet from September 2009 through August 2013. The numbers of outbreaks are shown for spring through summer (April through September) or fall through winter (October through March).
FIG 4
FIG 4
Time-ordered geographic distribution of GI.6 outbreaks in the eastern half of the United States by P2 subdomain phylogenetic analysis. The phylogenetic nucleotide tree of the GI.6 P2 subdomain was run in PhyML using the custom model TIM3ef+I, as determined by jModelTest using the corrected Akaike information criterion. Branch support was provided by the approximate likelihood ratio test. The distance of the root GI.6 VA497 (GenBank accession no. AF538678) is 1.46 nucleotides between the node of the two GI.6 clusters and reference GI.6. The truncated P2 tree shows the two main clusters of GI.6 circulating primarily in the eastern United States. The complete phylogenetic tree and corresponding outbreaks can be provided upon request. Outbreak information was downloaded from CaliciNet, and outbreaks from the eastern United States were mapped according to the latitude and longitude coordinates of the outbreak (squares). Overlapping outbreaks were jittered for clarity. The outbreak dates were time ordered, and the sizes of the squares indicate the order of the outbreaks within the cluster of the same color as the phylogenetic tree. Smaller squares indicate earlier outbreaks and larger squares indicate later outbreaks. The dates (month/day/year) and cities of the mapped outbreaks are listed in the tree.

References

    1. Glass RI, Parashar UD, Estes MK. 2009. Norovirus gastroenteritis. N. Engl. J. Med. 361:1776–1785. 10.1056/NEJMra0804575 - DOI - PMC - PubMed
    1. Payne DC, Vinjé J, Szilagyi PG, Edwards KM, Staat MA, Weinberg GA, Hall CB, Chappell J, Bernstein DI, Curns AT, Wikswo M, Shirley SH, Hall AJ, Lopman B, Parashar UD. 2013. Norovirus and medically attended gastroenteritis in U.S. children. N. Engl. J. Med. 368:1121–1130. 10.1056/NEJMsa1206589 - DOI - PMC - PubMed
    1. Lopman BA, Hall AJ, Curns AT, Parashar UD. 2011. Increasing rates of gastroenteritis hospital discharges in US adults and the contribution of norovirus, 1996–2007. Clin. Infect. Dis. 52:466–474. 10.1093/cid/ciq163 - DOI - PubMed
    1. Hall AJ, Curns AT, McDonald LC, Parashar UD, Lopman BA. 2012. The roles of Clostridium difficile and norovirus among gastroenteritis-associated deaths in the United States, 1999–2007. Clin. Infect. Dis. 55:216–223. 10.1093/cid/cis386 - DOI - PubMed
    1. Hall AJ, Lopman BA, Payne DC, Patel MM, Gastañaduy PA, Vinjé J, Parashar UD. 2013. Norovirus disease in the United States. Emerg. Infect. Dis. 19:1198–1205. 10.3201/eid1908.130465 - DOI - PMC - PubMed

Publication types