

A stable-isotope mass spectrometry-based metabolic footprinting approach to analyze exudates from phytoplankton
- PMID: 24172212
- PMCID: PMC3853721
- DOI: 10.3390/md11114158
A stable-isotope mass spectrometry-based metabolic footprinting approach to analyze exudates from phytoplankton
Abstract
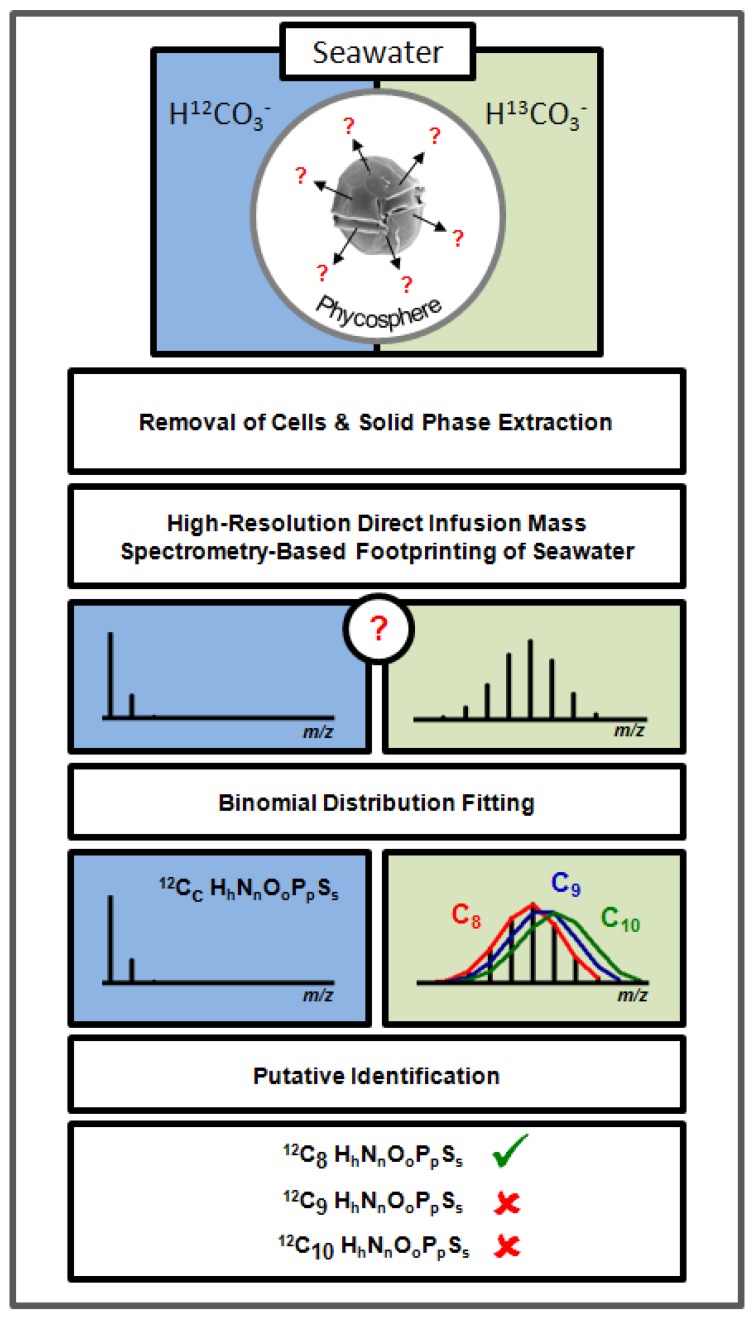
Phytoplankton exudates play an important role in pelagic ecology and biogeochemical cycles of elements. Exuded compounds fuel the microbial food web and often encompass bioactive secondary metabolites like sex pheromones, allelochemicals, antibiotics, or feeding attractants that mediate biological interactions. Despite this importance, little is known about the bioactive compounds present in phytoplankton exudates. We report a stable-isotope metabolic footprinting method to characterise exudates from aquatic autotrophs. Exudates from (13)C-enriched alga were concentrated by solid phase extraction and analysed by high-resolution Fourier transform ion cyclotron resonance mass spectrometry. We used the harmful algal bloom forming dinoflagellate Alexandrium tamarense to prove the method. An algorithm was developed to automatically pinpoint just those metabolites with highly (13)C-enriched isotope signatures, allowing us to discover algal exudates from the complex seawater background. The stable-isotope pattern (SIP) of the detected metabolites then allowed for more accurate assignment to an empirical formula, a critical first step in their identification. This automated workflow provides an effective way to explore the chemical nature of the solutes exuded from phytoplankton cells and will facilitate the discovery of novel dissolved bioactive compounds.
Figures
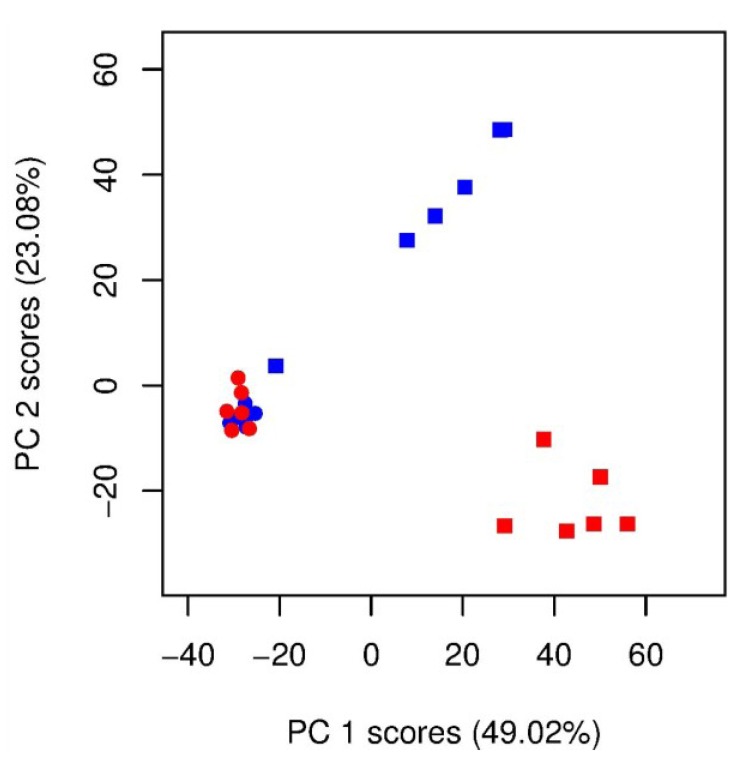
 ) unlabelled and 13C-labelled (
 ) seawater without algal cells (as controls, n = 6 each), and (
 ) unlabelled and (
 ) 13C-labelled cultures of Alexandrium tamarense (n = 6 each). The major separation along the PC1 axis corresponds to the differences between the metabolic footprints of seawater samples with versus without algal cells present. Separation along PC2 corresponds to differences between the metabolic footprints of 13C-labelled vs. unlabelled A. tamarense cultures.
Similar articles
-
Phytoplankton exudates and lysates support distinct microbial consortia with specialized metabolic and ecophysiological traits.Proc Natl Acad Sci U S A. 2021 Oct 12;118(41):e2101178118. doi: 10.1073/pnas.2101178118. Proc Natl Acad Sci U S A. 2021. PMID: 34620710 Free PMC article.
-
Competing phytoplankton undermines allelopathy of a bloom-forming dinoflagellate.Proc Biol Sci. 2008 Dec 7;275(1652):2733-41. doi: 10.1098/rspb.2008.0760. Proc Biol Sci. 2008. PMID: 18713720 Free PMC article.
-
[Studies on performance standard for hemolytic toxins in harmful bloom algae].Wei Sheng Yan Jiu. 2009 Nov;38(6):653-6. Wei Sheng Yan Jiu. 2009. PMID: 20047215 Chinese.
-
The Chemistry of Phytoplankton.Chem Rev. 2024 Dec 11;124(23):13099-13177. doi: 10.1021/acs.chemrev.4c00177. Epub 2024 Nov 21. Chem Rev. 2024. PMID: 39571071 Free PMC article. Review.
-
Stable isotope probing of carbon flow in the plant holobiont.Curr Opin Biotechnol. 2016 Oct;41:9-13. doi: 10.1016/j.copbio.2016.02.023. Epub 2016 Mar 25. Curr Opin Biotechnol. 2016. PMID: 27019410 Review.
Cited by
-
A complete workflow for high-resolution spectral-stitching nanoelectrospray direct-infusion mass-spectrometry-based metabolomics and lipidomics.Nat Protoc. 2016 Feb;12(2):310–328. doi: 10.1038/nprot.2016.156. Epub 2017 Jan 12. Nat Protoc. 2016. PMID: 28079878
-
Probing rapid carbon fixation in fast-growing seaweed Ulva meridionalis using stable isotope 13C-labelling.Sci Rep. 2020 Nov 23;10(1):20399. doi: 10.1038/s41598-020-77237-1. Sci Rep. 2020. PMID: 33230200 Free PMC article.
-
Application of stable isotope-assisted metabolomics for cell metabolism studies.Metabolites. 2014 Mar 31;4(2):142-65. doi: 10.3390/metabo4020142. Metabolites. 2014. PMID: 24957020 Free PMC article.
-
Solid phase extraction and metabolic profiling of exudates from living copepods.PeerJ. 2016 Jan 12;4:e1529. doi: 10.7717/peerj.1529. eCollection 2016. PeerJ. 2016. PMID: 26788422 Free PMC article.
-
Current Challenges in Plant Eco-Metabolomics.Int J Mol Sci. 2018 May 6;19(5):1385. doi: 10.3390/ijms19051385. Int J Mol Sci. 2018. PMID: 29734799 Free PMC article. Review.
References
-
- Bjornsen P.K. Phytoplankton exudation of organic-matter—Why do healthy cells do it. Limnol. Oceanogr. 1988;33:151–154. doi: 10.4319/lo.1988.33.1.0151. - DOI
-
- Van Donk E. Chemical information transfer in freshwater plankton. Ecol. Inf. 2007;2:112–120. doi: 10.1016/j.ecoinf.2007.03.002. - DOI
-
- Fistarol G.O., Legrand C., Selander E., Hummert C., Stolte W., Graneli E. Allelopathy in Alexandrium spp.: Effect on a natural plankton community and on algal monocultures. Aquat. Microb. Ecol. 2004;35:45–56. doi: 10.3354/ame035045. - DOI
Publication types
MeSH terms
Substances
LinkOut - more resources
Full Text Sources
Other Literature Sources
Miscellaneous
