

Longitudinal Modeling of the Relationship Between Mean Plasma Glucose and HbA1c Following Antidiabetic Treatments
- PMID: 24172651
- PMCID: PMC3817378
- DOI: 10.1038/psp.2013.58
Longitudinal Modeling of the Relationship Between Mean Plasma Glucose and HbA1c Following Antidiabetic Treatments
Abstract
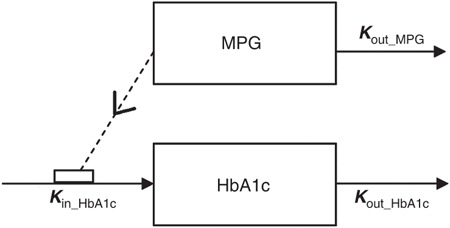
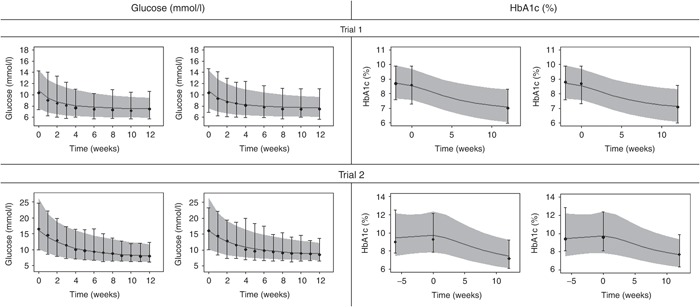
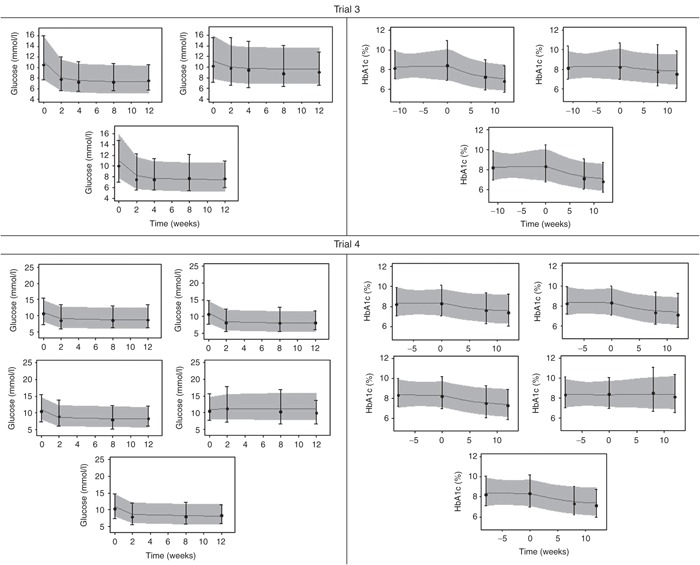
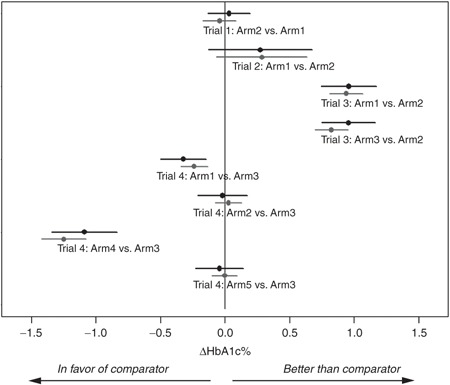
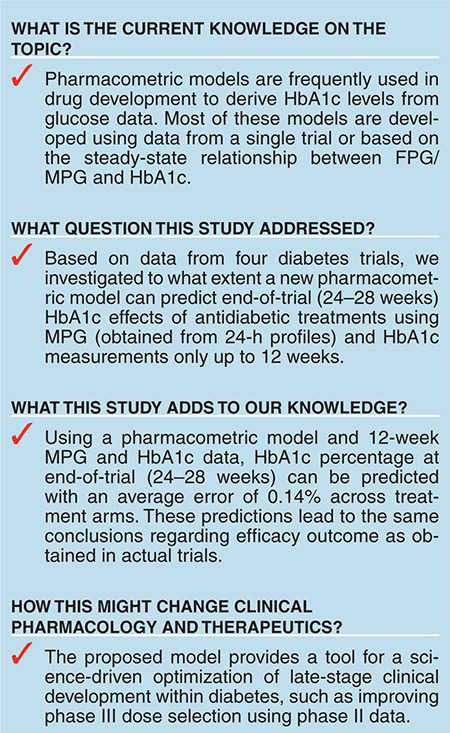
Late-phase clinical trials within diabetes generally have a duration of 12-24 weeks, where 12 weeks may be too short to reach steady-state glycated hemoglobin (HbA1c). The main determinant for HbA1c is blood glucose, which reaches steady state much sooner. In spite of this, few publications have used individual data to assess the time course of both glucose and HbA1c, for predicting HbA1c. In this paper, we present an approach for predicting HbA1c at end-of-trial (24-28 weeks) using glucose and HbA1c measurements up to 12 weeks. The approach was evaluated using data from 4 trials covering 12 treatment arms (oral antidiabetic drug, glucagon-like peptide-1, and insulin treatment) with measurements at 24-28 weeks to evaluate predictions vs. observations. HbA1c percentage was predicted for each arm at end-of-trial with a mean prediction error of 0.14% [0.01;0.24]. Furthermore, end points in terms of HbA1c reductions relative to comparator were accurately predicted. The proposed model provides a good basis to optimize late-stage clinical development within diabetes.CPT: Pharmacometrics & Systems Pharmacology (2013) 2, e82; doi:10.1038/psp.2013.58; advance online publication 30 October 2013.
Figures
Similar articles
-
Methods for Predicting Diabetes Phase III Efficacy Outcome From Early Data: Superior Performance Obtained Using Longitudinal Approaches.CPT Pharmacometrics Syst Pharmacol. 2014 Jul 2;3(7):e122. doi: 10.1038/psp.2014.20. CPT Pharmacometrics Syst Pharmacol. 2014. PMID: 24988185 Free PMC article.
-
Humalog Mix 25 in patients with type 2 diabetes which do not achieve acceptable glycemic control with oral agents: results from a phase III, randomized, parallel study.Rom J Intern Med. 2003;41(2):153-62. Rom J Intern Med. 2003. PMID: 15526500 Clinical Trial.
-
Oral Semaglutide Reduces HbA1c and Body Weight in Patients with Type 2 Diabetes Regardless of Background Glucose-Lowering Medication: PIONEER Subgroup Analyses.Diabetes Ther. 2021 Apr;12(4):1099-1116. doi: 10.1007/s13300-020-00994-9. Epub 2021 Mar 4. Diabetes Ther. 2021. PMID: 33660198 Free PMC article.
-
Pharmacometric Approaches to Guide Dose Selection of the Novel GPR40 Agonist TAK-875 in Subjects With Type 2 Diabetes Mellitus.CPT Pharmacometrics Syst Pharmacol. 2013 Jan 9;2(1):e22. doi: 10.1038/psp.2012.23. CPT Pharmacometrics Syst Pharmacol. 2013. PMID: 23887592 Free PMC article.
-
Rapid-Acting Insulin Analogues Versus Regular Human Insulin: A Meta-Analysis of Effects on Glycemic Control in Patients with Diabetes.Diabetes Ther. 2020 Mar;11(3):573-584. doi: 10.1007/s13300-019-00732-w. Epub 2019 Dec 23. Diabetes Ther. 2020. PMID: 31873857 Free PMC article. Review.
Cited by
-
Comparison of Power, Prognosis, and Extrapolation Properties of Four Population Pharmacodynamic Models of HbA1c for Type 2 Diabetes.CPT Pharmacometrics Syst Pharmacol. 2018 May;7(5):331-341. doi: 10.1002/psp4.12290. Epub 2018 Mar 25. CPT Pharmacometrics Syst Pharmacol. 2018. PMID: 29575656 Free PMC article.
-
Poor glycaemic control and its metabolic and demographic risk factors in a Malaysian community-based study.Int J Public Health. 2018 Mar;63(2):193-202. doi: 10.1007/s00038-017-1072-4. Epub 2018 Jan 25. Int J Public Health. 2018. PMID: 29372287
-
Optimization of trial duration to predict long-term HbA1c change with therapy: A pharmacometrics simulation-based evaluation.CPT Pharmacometrics Syst Pharmacol. 2022 Nov;11(11):1443-1457. doi: 10.1002/psp4.12854. Epub 2022 Sep 7. CPT Pharmacometrics Syst Pharmacol. 2022. PMID: 35899461 Free PMC article.
-
An Updated Organ-Based Multi-Level Model for Glucose Homeostasis: Organ Distributions, Timing, and Impact of Blood Flow.Front Physiol. 2021 Jun 1;12:619254. doi: 10.3389/fphys.2021.619254. eCollection 2021. Front Physiol. 2021. PMID: 34140893 Free PMC article.
-
Weight-HbA1c-insulin-glucose model for describing disease progression of type 2 diabetes.CPT Pharmacometrics Syst Pharmacol. 2016 Jan;5(1):11-9. doi: 10.1002/psp4.12051. Epub 2015 Dec 16. CPT Pharmacometrics Syst Pharmacol. 2016. PMID: 26844011 Free PMC article. Clinical Trial.
References
-
- Guidance for industry, diabetes mellitus: developing drugs and therapeutic biologics for treatment and preventionUS Department of Health and Human Services, FDA, Center for Drug Evaluation and Research (CDER), February 2008.
-
- Guideline on clinical investigation of medicinal products in the treatment of diabetes mellitusCommittee for Medicinal Products for Human Use (CHMP), CPMP/EWP/1080/00 Rev. 1, 14 May 2012, EMA.
-
- Jeff Coate S.L. Diabetes control and complications: the role of glycated haemoglobin, 25 years on. Diabet Med. 2004;21:657–665. - PubMed
-
- Hamrén B., Björk E., Sunzel M., Karlsson M. Models for plasma glucose, HbA1c, and hemoglobin interrelationships in patients with type 2 diabetes following tesaglitazar treatment. Clin. Pharmacol. Ther. 2008;84:228–235. - PubMed
LinkOut - more resources
Full Text Sources
Other Literature Sources
Miscellaneous
