. 2014 Jan;25(1):95-106.
doi: 10.1091/mbc.E13-07-0376. Epub 2013 Oct 30.

Direct observation of microtubule pushing by cortical dynein in living cells

Affiliations

Direct observation of microtubule pushing by cortical dynein in living cells

Tomáš Mazel et al. Mol Biol Cell. 2014 Jan.

Abstract

Microtubules are under the influence of forces mediated by cytoplasmic dynein motors associated with the cell cortex. If such microtubules are free to move, they are rapidly transported inside cells. Here we directly observe fluorescent protein-labeled cortical dynein speckles and motile microtubules. We find that several dynein complex subunits, including the heavy chain, the intermediate chain, and the associated dynactin subunit Dctn1 (also known as p150glued) form spatially resolved, dynamic speckles at the cell cortex, which are preferentially associated with microtubules. Measurements of bleaching and dissociation kinetics at the cell cortex reveal that these speckles often contain multiple labeled dynein heavy-chain molecules and turn over rapidly within seconds. The dynamic behavior of microtubules, such as directional movement, bending, or rotation, is influenced by association with dynein speckles, suggesting a direct physical and functional interaction. Our results support a model in which rapid turnover of cell cortex-associated dynein complexes facilitates their search to efficiently capture and push microtubules directionally with leading plus ends.


Figures

FIGURE 1:
FIGURE 1:
Rapid turnover of dynein complexes at the cell cortex. (A) Bleaching of individual EGFP-labeled dynein heavy-chain (Dync1h1) speckles in fixed COS7 cells (top) shows stepwise decrease in fluorescence intensity (middle). Fitting of a step function to the bleaching kinetics allows estimation of the number of EGFP molecules per speckle, which is displayed as histograms (bottom). After overnight depolymerization of microtubules with 10 μM nocodazole (n = 4896 speckles in four cells), the distribution of bleaching steps per speckle is shifted toward larger numbers compared with control fixed cells (n = 1982 speckles in three cells). (B) Rapid dissociation of EGFP-labeled dynein heavy-chain (Dync1h1) speckles from the cell cortex in living COS7 cells (top). Middle, to best illustrate the steplike dissociation, an unusually stable speckle that dissociates from the cortex within a single video frame after a prolonged delay is shown. The corresponding inset shows the more frequent, rapid dissociation within the first acquired video frames. The distribution of dissociation steps shows that speckles usually dissociate in a single step (bottom left; n = 1599 speckles in four cells). (C) Number of remaining EGFP-Dync1h1 molecules plotted against time. In fixed cells, the bleaching kinetics of initially detected individual EGFP molecules fits well to a single-exponential decay function (the average value was t1/2[bleach] = 46.2 ± 2.0 s, n = 4896 speckles in four cells). In living cells, the kinetics of EGFP-Dync1h1 dissociation does not fit a single-exponential decay (R = 0.94 ± 0.02). Assuming similar bleaching kinetics in fixed and living cells, a fast component, which is due to dynamic interaction of dynein speckles with the cortex, is detected using a double-exponential fit (t1/2[cortical] = 2.6 ± 0.9 s, fraction fast: 59 ± 13%, n = 1599 speckles in four cells; the t1/2 of the slow component was set to the average t1/2[bleach] obtained in fixed cells from the same experimental day). The overall density of speckles was 0.28 ± 0.05 (live cells) or 0.46 ± 0.13 (fixed cells) speckles/μm2 (n = 6 or 4 cells).
FIGURE 2:
FIGURE 2:
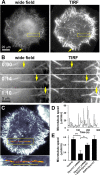
Directional movement of MAP2c-induced short microtubules along the cell cortex after nocodazole washout. (A) COS7 cells were imaged soon after nocodazole washout via wide-field or TIRF microscopy. The yellow arrow points to a more intensely labeled microtubule structure in a peripheral region that was formed during the accumulation of multiple weakly labeled short microtubules in the cell periphery (see also Supplemental Movie S1). (B) Example of a short microtubule that moves directionally near the cell cortex within the evanescent wave of the TIRF microscope (see also Supplemental Movie S1). (C) Automated tracking of short microtubules via TIRF microscopy (see Supplemental Figure S3 and Materials and Methods for details). The trajectory of microtubule movement (red) was overlaid onto the last video frame used for tracking. Blue, final position of tracked short microtubule. Yellow, tracked short microtubule endpoint. (D) Microtubule speed plotted against time reveals saltatory, rapid movements with intermittent pauses characterized by slow directional movements and Brownian motion. (E) Average speed of short microtubules in nocodazole-washout experiments in control Neuro2A cells and Neuro2A cells treated with shRNA targeting Dync1h1 and/or with EGFP-Dync1h1 (mean ± SEM; nexperiments = 8 for control, Dync1h1 shRNA, and Dync1h1 shRNA + EGFP-Dync1h1; nexperiments = 4 for EGFP-Dync1h1 alone). Dynein heavy-chain silencing resulted in a significant decrease in average short microtubule speeds, which was largely recovered by simultaneous expression of shRNA-resistant EGFP-Dync1h1 construct. *p < 0.05; **p < 0.01; one-way analysis of variance.
FIGURE 3:
FIGURE 3:
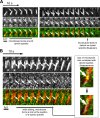
Colocalization of dynein complexes with short microtubules. (A) Two-color TIRF microscopic analysis of the EGFP-labeled dynein heavy chain (EGFP-Dync1h1) and mCherry-labeled MAP2c–decorated microtubules in COS7 cells. A subpopulation of dynein speckles (green) overlaps with MAP2c-induced microtubules (red) at the cell cortex. (B) Determination of the percentage of speckles that overlap with MAP2c-decorated short microtubules reveals their preferential association: About 28% of speckles are colocalized with short microtubules. By shifting the dynein channel by >1 pixel relative to the microtubule channel, this apparent colocalization is reduced to the expected value for random overlap, which was calculated to be ∼23%. The observed colocalization was consistently higher than the expected random overlap (4.3 ± 0.6%, p < 0.0001; Student's paired t test; n = 9 cells). See Supplemental Figure S7A for analysis of additional dynein components. (C) Left, five different dynamic behaviors can be distinguished by automated speckle and short-microtubule tracking. The relative fractions for observation of these cases are shown (based on 10,478 three-frame subtrajectories from four cells). Measurements are shown as percentages with SEM. The two most common cases are underlined. Right, examples of observations belonging to these cases are shown above the schematics of their interpretation. The first example illustrates case 2, in which a dynein speckle moves toward the trailing end of a moving short microtubule (white arrowheads). The example for the more frequently observed case 3 shows a short microtubule, which slides along a stationary dynein speckle. In the rarely observed case 5, dynein speckles usually accumulate at the trailing end of motile microtubules and translocate together with them in the same direction (large white arrows; see also Supplemental Figure S7C). For the example of case 2, first the dynein speckle moves leftward (white arrowheads) while the microtubule is stationary, corresponding to case 2, followed by a short rightward movement (white small arrows) of the microtubule and a relatively stationary dynein speckle characteristic of case 3, suggesting that microtubules and dynein speckles can rapidly switch their motile behavior. See also Supplemental Movies S5–S8. MT: microtubule.
FIGURE 4:
FIGURE 4:
Correlation of dynein speckle dynamics with short-microtubule behavior. (A) Sequence showing a short microtubule, which pivots around a dynein speckle. At the first encounter with a dynein speckle, the short microtubule moves only marginally. After this brief delay, the short microtubule swivels around the dynein speckle (white arrows) while moving forward. At a later time point, a visible speckle (white arrows) accumulates at the trailing end of the same short microtubule. The disappearance of this speckle correlates with microtubule detachment from the cell cortex. (B) Sequence of a short microtubule that forms a transient kink during sliding. The short microtubule slides directionally and forms a kink at the position of a bright and persistent speckle (white arrows). This kink is lost from one frame to the other, simultaneous with the loss of this bright speckle (see also enlarged inset). See also Supplemental Figure S8 and Supplemental Movies S9 and S10.
FIGURE 5:
FIGURE 5:
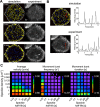
Stochastic simulations of short-microtubule movements. Microtubules (yellow), dynein speckles (blue), and their interactions were modeled based on experimental observations and known physical properties of system components (for details, see Materials and Methods and experimental parameters in Table 2). (A) Stochastic simulations closely mimic the experimentally observed distribution of microtubules over time as they accumulate at the cell periphery (see also Supplemental Movie S11). The initial time point (0 min) is defined as the first observation of nucleated microtubules after nocodazole washout. Immobile microtubules anchored to the microtubule-organizing center observed in the experiment (white arrow) are not included in the simulation. (B) Tracking of individual short microtubules shows that dynamic microtubule behavior, with intermittent bursts and pauses of rapid motility, is observed in both simulations and experiments. (C) Systematic variation of speckle density and speckle half-life in simulations lacking a cell border. Three heat maps visualize the average short-microtubule velocity, as well as the frequency and duration of movement bursts. Each colored subsquare corresponds to one simulation with random initial conditions.

Comment in

Similar articles

Cited by

References

    1. Ahmad FJ, He Y, Myers KA, Hasaka TP, Francis F, Black MM, Baas PW. Effects of dynactin disruption and dynein depletion on axonal microtubules. Traffic. 2006;7:524–537. - PubMed
    1. Ahmad FJ, Hughey J, Wittmann T, Hyman A, Greaser M, Baas PW. Motor proteins regulate force interactions between microtubules and microfilaments in the axon. Nat Cell Biol. 2000;2:276–280. - PubMed
    1. Collins ES, Balchand SK, Faraci JL, Wadsworth P, Lee WL. Cell cycle-regulated cortical dynein/dynactin promotes symmetric cell division by differential pole motion in anaphase. Mol Biol Cell. 2012;23:3380–3390. - PMC - PubMed
    1. Dehmelt L, Bastiaens PI. Spatial organization of intracellular communication: insights from imaging. Nat Rev Mol Cell Biol. 2010;11:440–452. - PubMed
    1. Dehmelt L, Bastiaens P. Self-organization in cells. In: Meyer-Ortmanns H, Thurner S, editors. In: Principles of Evolution. Heidelberg, Germany: Springer; 2011. pp. 219–238.

Publication types