. 2013 Nov 25;14(17):2263-7.
doi: 10.1002/cbic.201300562. Epub 2013 Oct 31.

Dual targeting of the Warburg effect with a glucose-conjugated lactate dehydrogenase inhibitor

Affiliations

Dual targeting of the Warburg effect with a glucose-conjugated lactate dehydrogenase inhibitor

Emilia C Calvaresi et al. Chembiochem. .

Abstract

Effective glucose diet: We report the development and activity of glucose-conjugated LDH-A inhibitors designed for dual targeting of the Warburg effect (elevated glucose uptake and glycolysis) in cancer cells. Glycoconjugation could be applied to inhibitors of many enzymes involved in glycolysis or tumor metabolism.

Keywords: Warburg effect; cancer; drug design; glycoconjugation; targeted anticancer agents.


Figures

Figure 1
Figure 1
A) Dual-targeting of the Warburg effect by a glucose-conjugated LDH-A inhibitor. B) Structures and in vitro Ki values vs. NADH in LDH-A of unconjugated and glucose-conjugated N-hydroxyindole (NHI) class compounds. Values are reported as the mean ± SD of three or more independent experiments.
Figure 2
Figure 2
Binding pose resulting from MD simulation of the LDH-A complex with compound NHI-Glc-2. A) disposition of the ligand into the enzyme active site displaying the protein backbone; B) skewed view of the complex showing the protein residues that are most relevant for interaction with the inhibitor.
Figure 3
Figure 3
A)Treatment of HeLa cells with various compounds indicates that NHI-Glc-2 dose-dependently reduces lactate production, comparing favorably in this regard to NHI-2. The effect of NHI-Glc-2 is significantly more potent than that of NHI-1, NHI-Glc-1, and other reported LDH-A inhibitors, FX-11, galloflavin, and AZ 33. HeLa cells were treated for 8 hours with compound or DMSO vehicle (1% final concentration DMSO) in DMEM media. To quantify the lactate produced by the cells, derivatized cell culture media was analyzed by GC-MS. Lactate peaks were normalized using an internal standard present in each sample, and are presented as percent of vehicle lactate production. Averages are shown, with error bars denoting standard error of three or more independent experiments. B) Compound NHI-Glc-2 is more readily taken up by cancer cells than NHI-1 or NHI-2. A549 cells were treated with compound (100 µM) or vehicle (0.2% final concentration DMSO). Cells were collected after 4 hours, washed twice in PBS, sonicated in methanol, and analyzed via LC-MS. UV trace integration areas, standardized by sample fresh weights, were converted to relative concentrations using calibration of known concentrations (Figure S4). Relative concentrations are presented as ratios of the concentration of NHI-1. Error is standard error of three or more independent experiments.
Figure 4
Figure 4
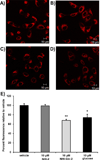
A549 cells were grown in RPMI 1640 growth media on cover glass bottom dishes (60,000 cells/dish). When cells reached 70% confluence, they were treated with GB2-Cy3 (2.5 µM) A) in the absence or B) the presence of NHI-2 (10 µM), C) NHI-Glc-2 (10 µM), or D) glucose (10 µM) for 30 minutes at 37 °C. Cellular fluorescence was observed using a Zeiss LSM700 confocal microscope, using a photomultiplier gain of 844 and a laser power of 555 nm (representative images are shown). E) The intracellular fluorescence of NHI-Glc-2- and glucose-treated cells is statistically significantly less than that of vehicle-treated cells, indicating that the uptake of the fluorescent GB2-Cy3 probe in these cells was inhibited by treatment with NHI-Glc-2 and glucose. The mean fluorescence intensities of each sample were calculated by averaging the fluorescence intensities of 40–60 cells per treatment over three independent experiments. Error bars denote standard error (n=3); statistical analysis was performed using an unpaired, two-tailed Student’s t test. * denotes p<0.05; ** denotes p<0.01.

Similar articles

Cited by

References

    1. Warburg O. Science. 1956;123:309–314. - PubMed
    1. Vander Heiden MG. Nat Rev Drug Discov. 2011;10:671–684. - PubMed
    2. Jones NP, Schulze A. Drug Discov Today. 2012;17:232–241. - PubMed
    1. Chan DA, Sutphin PD, Nguyen P, Turcotte S, Lai EW, Banh A, Reynolds GE, Chi JT, Wu J, Solow-Cordero DE, Bonnet M, Flanagan JU, Bouley DM, Graves EE, Denny WA, Hay MP, Giaccia AJ. Sci Transl Med. 2011;3:94ra70. - PMC - PubMed
    2. Luo F, Liu X, Yan N, Li S, Cao G, Cheng Q, Xia Q, Wang H. BMC Cancer. 2006;6:26. - PMC - PubMed
    1. Altenberg B, Greulich KO. Genomics. 2004;84:1014–1020. - PubMed
    1. Bensinger SJ, Christofk HR. Semin Cell Dev Biol. 2012;23:352–361. - PubMed

Publication types

MeSH terms