. 2013 Dec;11(12):1624-35.
doi: 10.1158/1541-7786.MCR-13-0371-T. Epub 2013 Oct 30.

PKCι maintains a tumor-initiating cell phenotype that is required for ovarian tumorigenesis

Affiliations

PKCι maintains a tumor-initiating cell phenotype that is required for ovarian tumorigenesis

Yin Wang et al. Mol Cancer Res. 2013 Dec.

Abstract

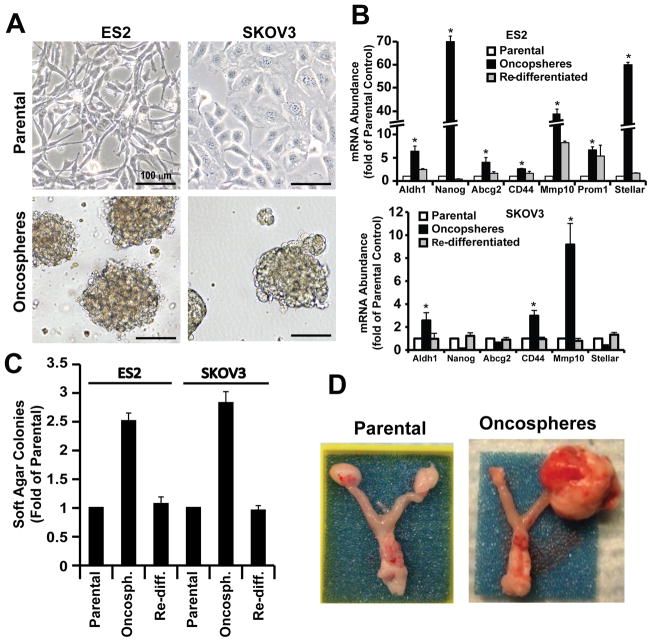
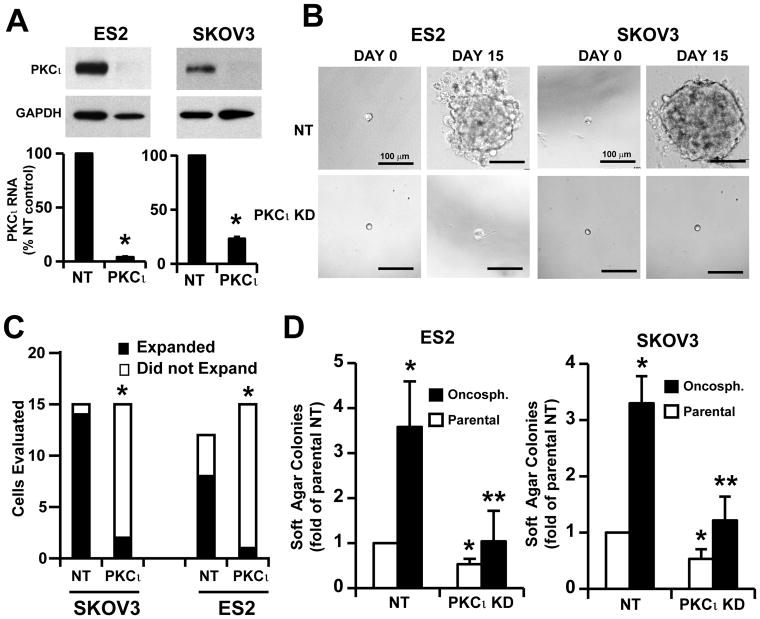
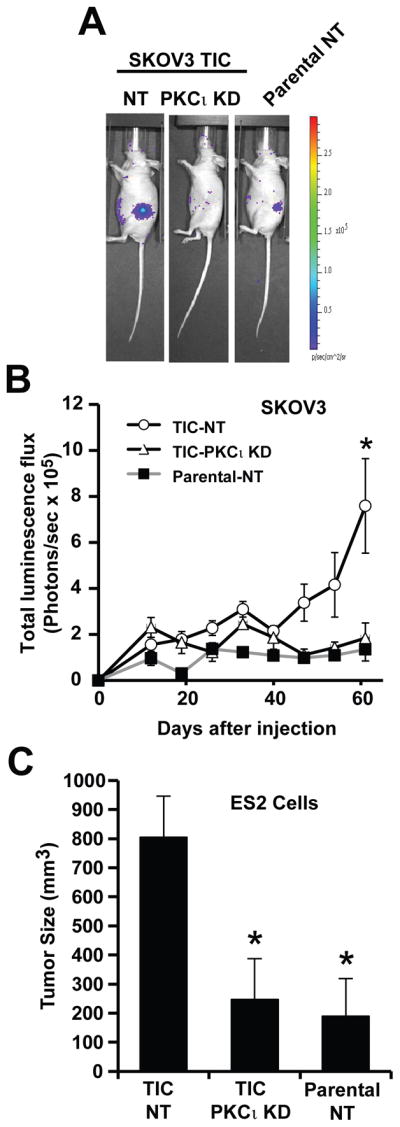
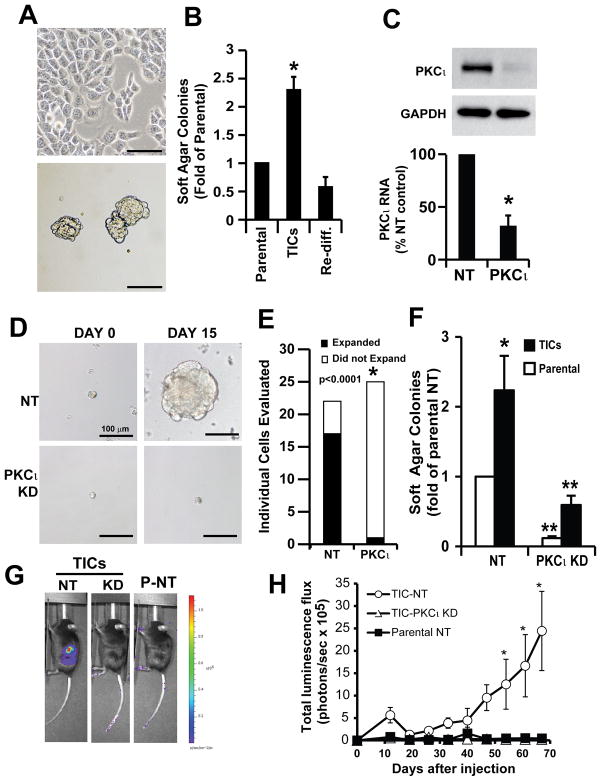
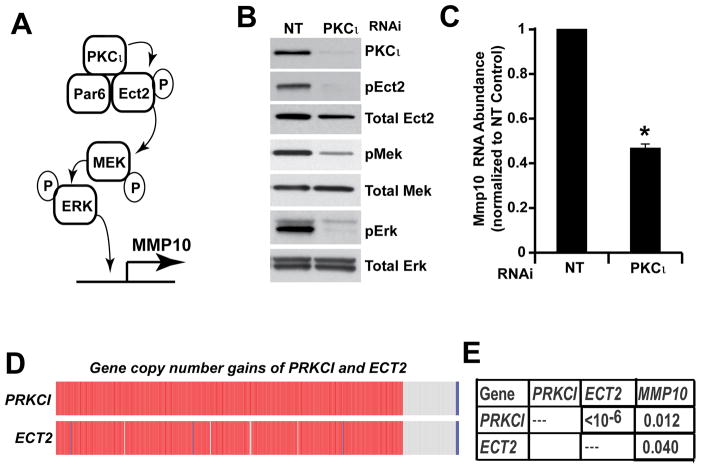
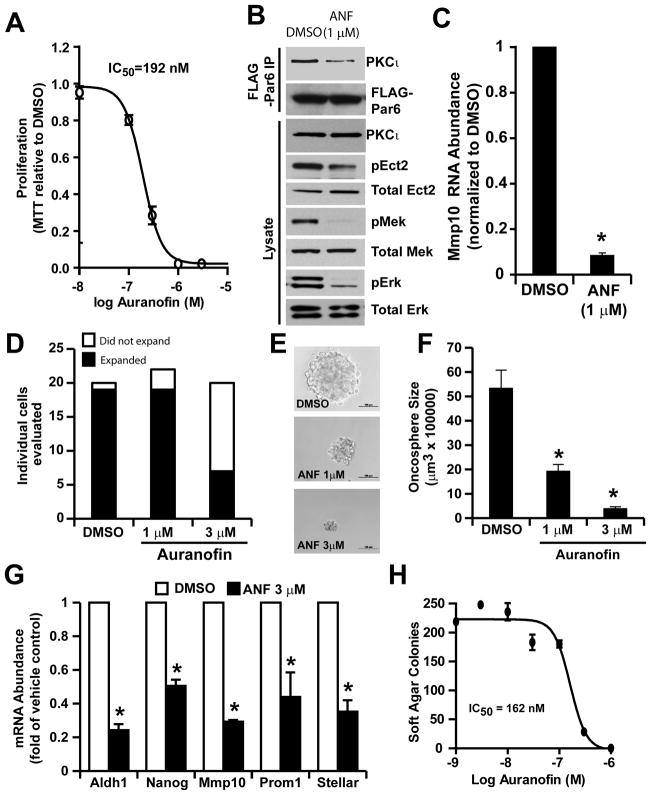
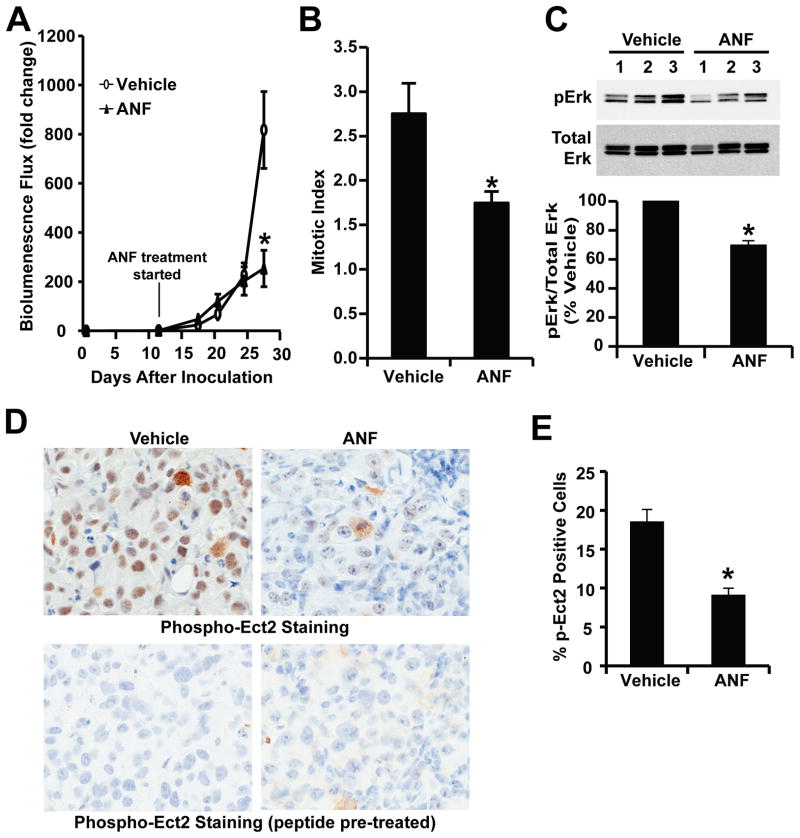
Protein kinase Cι (PKCι) has oncogenic potential and is an attractive therapeutic target for treatment of lung cancer, particularly those tumors that express elevated PKCι. However, whether PKCι is a viable target in ovarian cancer is unknown, and virtually nothing is known about the mechanism by which PKCι drives ovarian tumorigenesis. Here, it is demonstrated that PKCι maintains a tumor-initiating cell (TIC) phenotype that drives ovarian tumorigenesis. A highly tumorigenic population of cells from human ovarian cancer cell lines exhibit cancer stem-like TIC properties, including self-renewal, clonal expansion, expression of stem-related genes, enhanced transformed growth in vitro, and aggressive tumor-initiating activity in vivo. Genetic disruption of PKCι inhibits the proliferation, clonal expansion, anchorage-independent growth, and enhanced tumorigenic properties of ovarian TICs. Biochemical analysis demonstrates that PKCι acts through its oncogenic partner Ect2 to activate a MEK/ERK signaling axis that drives the ovarian TIC phenotype. Genomic analysis reveals that PKCι and Ect2 are coordinately amplified and overexpressed in the majority of primary ovarian serous tumors, and these tumors exhibit evidence of an active PKCι-Ect2 signaling axis in vivo. Finally, this study reveals that auranofin, a potent and selective inhibitor of oncogenic PKCι signaling, inhibits the tumorigenic properties of ovarian TIC cells in vitro and in vivo. These data demonstrate that PKCι is required for a TIC phenotype in ovarian cancer, and that auranofin is an attractive therapeutic option to target deadly ovarian TICs in ovarian cancer patients.

Implications: PKCι drives a tumor-initiating cell phenotype in ovarian cancer cells that can be therapeutically targeted with auranofin, a small molecule inhibitor of PKCι signaling.


Conflict of interest statement

The authors declare that they have no conflicts of interest

Figures

Figure 1
Figure 1. Ovarian cancer oncospheres exhibit a tumor-initiating cell (TIC) phenotype
A) Phase contrast photographs of ovarian cancer cells (ES2 and SKOV3) grown in adherent culture (upper panel) and in non-adherent culture as oncospheres (lower panel). B) Oncospheres from SKOV3 and ES2 cells express elevated levels of subsets of stem cell markers including ALDH1, NANOG, ABCG2, CD44, MMP10, PROM1 and STELLAR. Data are expressed as mean fold-change from parental cells +/− SEM. n=3; *p<0.05. C) Ovarian oncospheres exhibit enhanced anchorage-independent growth. Re-diff.: re-differentiated oncospheres. Data are expressed as mean fold-change from parental cells +/− SEM. n=5; *p<0.001. D) Oncospheres from ES2 cells exhibit enhanced tumor-initiating potential. Photographs of representative tumors were taken 27 days after orthotopic injection of 1,000 parental or oncosphere cells.
Figure 2
Figure 2. PKCι is required for clonal expansion and anchorage-independent growth of ovarian TICs in vitro
A) Immunoblot and Q-PCR analysis demonstrating efficient knockdown of PKCι in ES2 and SKOV3 ovarian cancer cell lines. Cells were transduced with recombinant lentivirus containing shRNA targeting PKCι (PKCι KD) or non-target shRNA (NT) followed by selection in puromycin for 2 weeks. B) Knockdown of PKCι inhibits clonal expansion of ovarian TICs. Individual ES2 and SKOV3 TICs were photographed at day 0 and day 15 in non-adherent culture in 96 well plates. C) Statistical analysis of clonal expansion in NT and PKCι KD ES2 and SKOV3 TICs. PKCι KD significantly inhibits clonal expansion of ES2 and SKOV3 TICs. *p<0.001. D) PKCι KD inhibits anchorage-independent growth of ovarian TICs in soft agar. Both TICs (black bars) and parental cells (white bars) exhibit PKCι-dependent soft agar colony formation. Data are expressed as mean fold-change from NT parental cells +/− SEM. n=5; *p<0.05 compared to NT parental cells; **p<0.05 compared to NT TICs.
Figure 3
Figure 3. PKCι is required for the tumor initiating activity of ovarian TICs in vivo
A. In vivo luminescence (IVIS) imaging of representative mice 60 days after injection orthotopically with 1,000 viable cells derived from NT parental SKOV3 cells, NT SKOV3 TICs or PKCι KD SKOV3 TICs. TICs exhibit enhanced tumor-initiating ability compared to parental cells. PKCι KD inhibits the enhanced tumor initiating properties of SKOV3 TICs. B) SKOV3 NT parental cell, NT TIC and PKCι KD TIC tumor growth was monitored by IVIS at the indicated time points after injection of 1,000 viable cells into recipient mice. Data are expressed as mean of total luminescence flux +/− SEM. n=4; * p<0.05 compared to parental NT (P-NT) or PKCι KD TICs. C) Orthotopic ES2 tumors were assessed for tumor size after injection of 1,000 ES2 NT parental, NT TICs and PKCι KD TICs as described in Materials and Methods. Data are expressed as mean tumor size (mm3) +/− SEM. n=6; *p<0.05 compared to NT TICs.
Figure 4
Figure 4. PKCι is required for the tumor-initiating phenotype of murine ID8 ovarian cancer cells
A) Phase contrast photographs of parental ID8 cells (upper panel) and oncospheres (lower panel). Scale bar = 100 μm. B) ID8 oncospheres exhibit enhanced anchorage-independent growth in soft agar. Re-diff: re-differentiated oncosphere cells. Data expressed as mean fold change +/− SEM compared to parental ID8 cells. n=5; *p<0.05. C) Immunoblot (upper panel) and Q-PCR analysis (lower panel) confirming efficient knockdown of PKCι in ID8 cells. Data expressed as mean % NT control +/− SEM. n=3; *p<0.05. D) Representive images of individual NT and PKCι KD ID8 TICs under clonal expansion conditions. E) Statistical analysis of clonal expansion of NT and PKCι KD ID8 TICs. PKCι KD significantly inhibits clonal expansion of ID8 TICs. *p<0.0001. F) PKCι KD significantly inhibits anchorage-independent growth of ID8 parental cells and TICs. Data expressed as mean fold change in colony numbers +/− SEM compared to parental NT cells. n=5; *p<0.05 compared to NT parental cells; **p<0.05 compared to their respective NT control cells. G) Representative IVIS images showing tumor growth of NT TIC, PKCι KD TIC and parental NT cells after orthotopic injection into syngeneic C57B6 mice. H) Growth of orthotopic ovarian ID8 tumors from TIC NT, TIC PKCι KD and parental NT cells. Data are expressed as mean total luminescence flux +/− SEM. n=6; *p<0.05 compared with parental NT and PKCι KD TICs.
Figure 5
Figure 5. PKCι activates a PKCι-Par6-Ect2-Mek-Erk signaling cascade in ovarian TICs
A) Schematic of the oncogenic PKCι signaling cascade identified in non-small cell lung cancer cells. B) PKCι KD in ES2 TICs causes a decrease in phosphorylation of T328 on Ect2, a previously characterized PKCι phosphorylation site on Ect2, and commensurate decreases in pMek and pErk levels. C) PKCι KD inhibits expression of MMP10, a transcriptional target of PKCι. Data are expressed as mean MMP10 RNA abundance normalized to NT control. n=3,*p<0.05 compared to NT control. D) PRKCI and ECT2 are co-amplified in primary ovarian serous carcinomas. Oncoprint readout of PRKCI and ECT2 gene copy number gains in primary ovarian serous carcinomas from The Cancer Gene Atlas (TCGA) dataset. Data reveal that PRKCI and ECT2 are virtually always co-amplified in ~80% ovarian serous carcinoma tumors. E) Analysis of PRKCI, ECT2 and MMP10 mRNA expression in primary ovarian serous tumors from the TCGA dataset reveal a strong positive correlation between expression of these three genes.
Figure 6
Figure 6. Auranofin (ANF) inhibits PKCι signaling and the ovarian TIC phenotype in vitro
A) The PKCι inhibitor auranofin (ANF) exhibits dose-dependent inhibition of ovarian TIC proliferation. ES2 TICs were grown in non-adherent oncosphere culture in the presence of the indicated concentration of ANF. MTT reduction was assessed after 5 days of ANF treatment. Data are expressed as MTT reduction relative to DMSO-treated control cells +/− SEM, n=3. Data are representative of three independent experiments. B) ANF inhibits PKCι signaling in ovarian TICs. ES2 TICs transfected with FLAG-Par6 plasmid were treated for 24 hours with DMSO or ANF (1 μM) and cellular lysates were subjected to FLAG immunoprcipitation followed by immunoblot analysis for Par6-bound PKCι and FLAG Par6 (upper panels). ANF-treated TICs exhibit a decrease in PKCι-Par6 binding. Total lysates from ES2 TICs revealed a decrease in pEct2, pMek and pErk in ANF-treated TICs when compared to DMSO-treated control TICs. C) Treatment of ES2 TICs with 1 μM ANF led to a decrease in MMP10 mRNA abundance as determined by Q-PCR analysis. Data are expressed as mean MMP10 mRNA abundance normalized to DMSO control cells. n=3. *p<0.01 compared to DMSO control cells. D) ANF inhibits clonal expansion of ES2 TICs. E) Representative photomicrographs of TIC oncospheres from single DMSO and ANF treated ES2 TICs after 15 days in oncosphere culture. F) ANF inhibits oncosphere growth. Data are expressed as mean oncosphere size (μm3) +/− SEM; n=19, 19, 7 for DMSO, 1 μM ANF, 3 μM ANF group, respectively; *p<0.01 compared with DMSO. G) ANF treatment for 24 hours inhibits expression of stem cell makers in ES2 TICs. Q-PCR results are expressed as mean fold change in mRNA abundance +/− SEM compared with DMSO treated cells. n=3; *p<0.05. H) ANF inhibits anchorage-independent growth of ES2 TICs in soft agar.
Figure 7
Figure 7. Auranofin (ANF) inhibits PKCι signaling and ovarian tumor growth in vivo
Orthotopic ES2 TIC tumors were established in immune-deficient nude mice by orthotopic injection of 1,000 ES2 TICs into the capsule of the ovary as described in Materials and Methods. At day 11, tumor-bearing mice were randomly assigned to receive either ANF (12 mg/kg/day/six days a week) or the same volume and frequency of vehicle solution (NaCl, 0.9%) for the duration of the experiment. A) Quantitative analysis of tumor growth by IVIS bioluminescence. The results are expressed as mean fold change of luminescence in each treated mouse compared to day 11 +/−SEM. n=5; *p<0.05. B) Sections from tumors were analyzed for mitotic index as described in Materials and Methods. Tumors from ANF-treated mice exhibited a decrease in mitotic index compared to diluent-treated control mice. n=5; *p<0.05. C) Immunoblot analysis (upper panel) of tumor lysates from diluent and ANF treated mice revealed a decrease in pERK levels in ANF-treated tumors. Quantitative analysis of pErk blots demonstrates a significant decrease in pErk levels in ANF-treated mouse tumors when compared to diluent-treated control mice. n=3. *p<0.05. D) Immunohistochemical staining of representative diluent- and ANF-treated tumors for pEct2. ANF treatment led to a decrease in pEct2 staining when compared to diluent control tumors. Staining was abolished by pre-incubation with Ect2 phospho-peptide antigen as described previously (16) indicating the specificity of the staining for pECt2 antigen. E) Quantitative analysis of pEct2 immunohistochemical staining reveals a significant decrease in pEct2 staining in ANF-treated tumors compared to diluent control tumors. n=5; *p<0.05.

References

    1. Cannistra SA. Cancer of the ovary. N Engl J Med. 2004;351:2519–29. - PubMed
    1. Scotti ML, Bamlet WR, Smyrk TC, Fields AP, Murray NR. Protein kinase Ciota is required for pancreatic cancer cell transformed growth and tumorigenesis. Cancer Res. 2010;70:2064–74. - PMC - PubMed
    1. Regala RP, Weems C, Jamieson L, Khoor A, Edell ES, Lohse CM, et al. Atypical protein kinase C iota is an oncogene in human non-small cell lung cancer. Cancer Res. 2005;65:8905–11. - PubMed
    1. Murray NR, Jamieson L, Yu W, Zhang J, Gokmen-Polar Y, Sier D, et al. Protein kinase Ciota is required for Ras transformation and colon carcinogenesis in vivo. J Cell Biol. 2004;164:797–802. - PMC - PubMed
    1. Takagawa R, Akimoto K, Ichikawa Y, Akiyama H, Kojima Y, Ishiguro H, et al. High expression of atypical protein kinase C lambda/iota in gastric cancer as a prognostic factor for recurrence. Ann Surg Oncol. 2010;17:81–8. - PubMed

Publication types

MeSH terms