. 2014 Jan;111(2):350-60.
doi: 10.1152/jn.00350.2013. Epub 2013 Oct 30.

Nucleus accumbens responses differentiate execution and restraint in reward-directed behavior

Affiliations

Nucleus accumbens responses differentiate execution and restraint in reward-directed behavior

Jamie D Roitman et al. J Neurophysiol. 2014 Jan.

Abstract

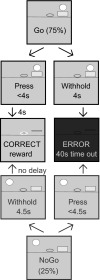
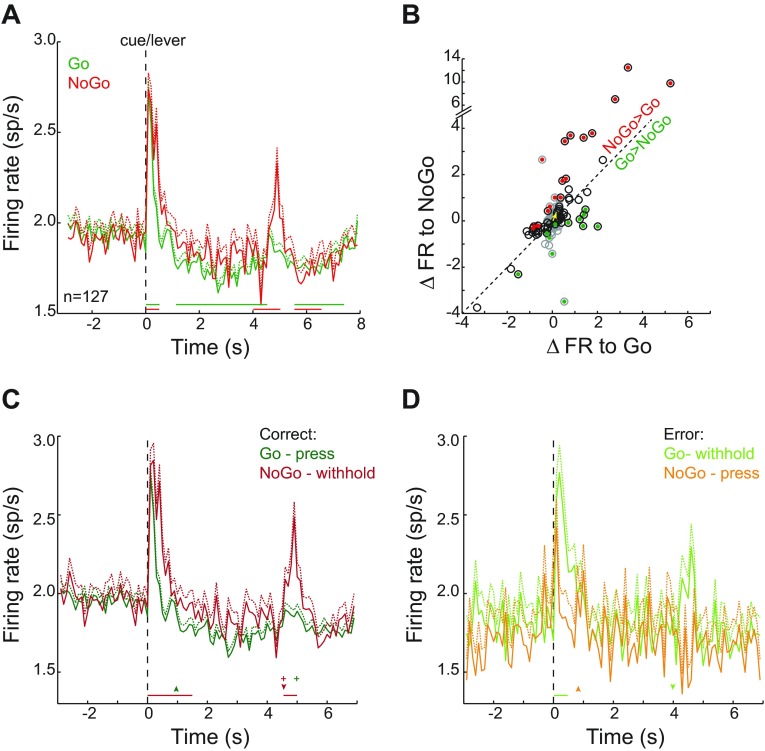
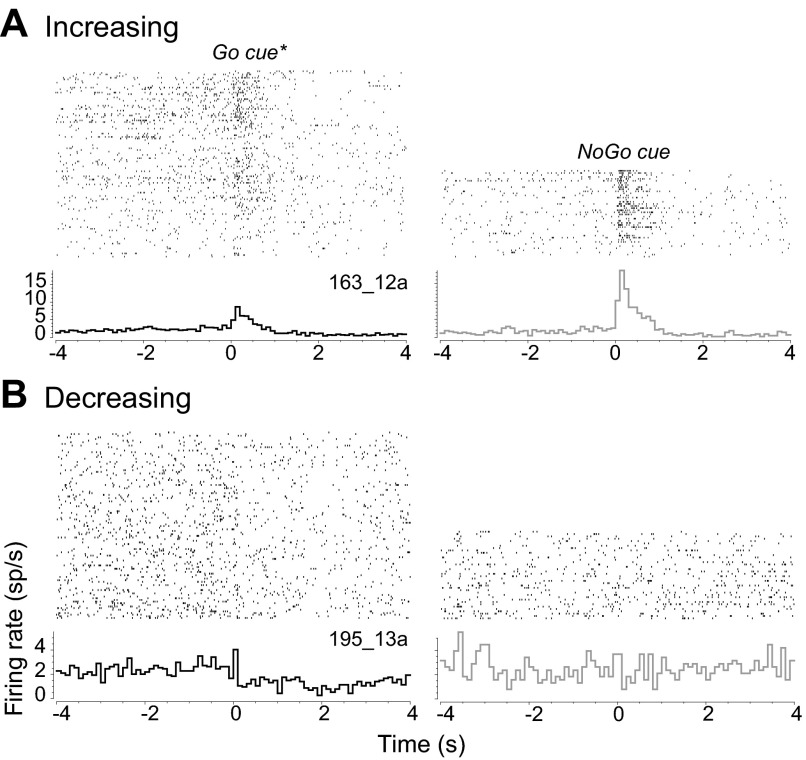
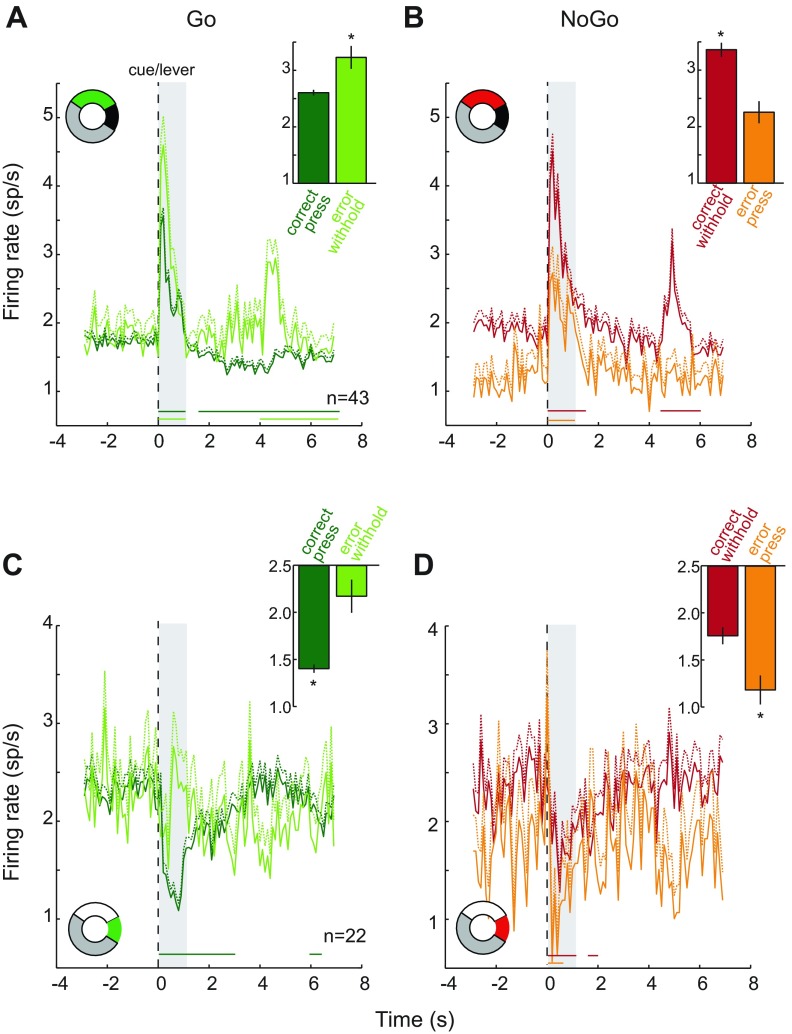
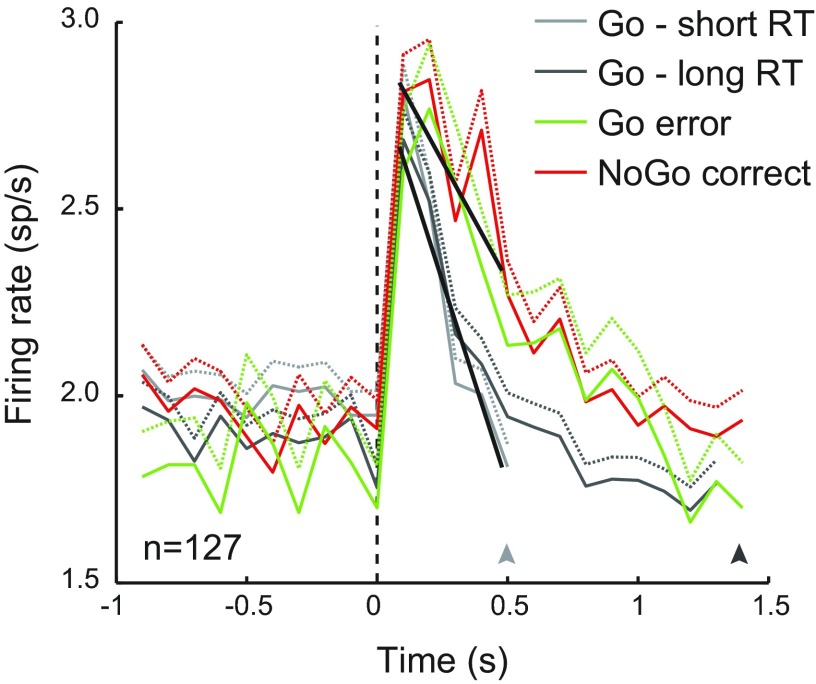
Our behavior is powerfully driven by environmental cues that signal the availability of rewarding stimuli. We frequently encounter stimuli-a bowl of candy or an alert from our smartphone-that trigger actions to obtain those rewards, even though there may be positive outcomes associated with not acting. The inability to restrain one's action in the presence of reward-associated cues is one type of impulsive behavior and a component of such maladaptive behaviors as overeating, gambling, and substance abuse. The nucleus accumbens (NAc) is ideally situated to integrate multiple cognitive and affective inputs to bias action via outputs through the basal ganglia. NAc neurons have been shown to respond to cues that predict reward availability, goal-directed behaviors aimed at obtaining them, and delivery of the reward itself. As these processes are typically associated, it is difficult to discern whether signals in the NAc are more closely related to processing reward-predictive aspects of goal-directed behavior or selection of behavioral response. To dissociate these possibilities, we recorded the activity of NAc neurons while rats performed a task in which two different cues both informed rats of reward availability but required them to either press a lever (Go) or withhold pressing (NoGo) to obtain the reward. Individual cue-responsive neurons showed either increases or decreases in activity at cue onset. Increases in activity were larger, and decreases smaller, when rats withheld lever pressing, whether correctly for NoGo trials or in error on Go trials. Thus NAc cue responses correlated with action, regardless of cue type or accuracy.

Keywords: executive control; nucleus accumbens; reward; rodent.


Figures

Fig. 1.
Fig. 1.
The symmetrical Go/NoGo task dissociates relationship between cue, behavioral response, and outcome. On all trials, the same lever is presented to initiate a trial concurrently with a cue that instructs the rat to either press the lever or withhold pressing to obtain a sucrose pellet reward. On 75% of trials, a Go cue (light above lever) signals the rat to press the lever. If the rat presses the lever within 4 s, it receives a sucrose pellet after a 4-s delay; otherwise, the lever retracts and a 40-s time-out begins during which the house light is extinguished and no trials will be initiated. On the remaining 25% of trials, a NoGo cue (light on opposite side of pellet receptacle from lever) signals the rat to withhold pressing the lever. If the rat successfully withholds pressing for 4.5 s, the lever retracts and the rat immediately receives a sucrose pellet. If the rat presses the lever before the 4.5 s expires, the lever retracts, the house light is extinguished, and a 40-s time-out is initiated. For each rat, an audio cue (0.5 s white noise) is paired with the onset of either the Go cue or the NoGo cue. With this task, trained rats associate both cues with the opportunity to obtain reward but have to control whether to approach and press the lever or withhold this behavioral response.
Fig. 2.
Fig. 2.
Rats performed the Go/NoGo task accurately and did not delay execution of responses. A: the proportion of correct trials was high for both Go (89.6 ± 1.4% of 1,248) and NoGo (76.5 ± 6.4% of 451) trials. B: response times (RTs) are shorter for lever presses in error on NoGo trials than correct presses on Go trials. Distributions of RT are shown for correct Go trials (black, n = 1,118) and error NoGo trials (gray, n = 106). Average RT for presses following the NoGo cue (677 ± 77 ms, gray arrowhead) was shorter than that for the Go cue (955 ± 24 ms, black arrowhead). Inset: mean RT for lever presses on NoGo trials plotted as a function of mean RT for Go presses for each rat. For 10/11 subjects, RT was faster for incorrect NoGo presses than correct Go presses, suggesting that rats' failure to inhibit presses occurred in the immediate response to the cue. C: latency to nose poke at the central port is shorter after Go cues (2.61 ± 0.05 s) than NoGo cues (3.06 ± 0.12 s). Inset: mean latency to nose poke after cue onset on NoGo trials plotted as a function of mean latency to nose poke after Go cue for each rat. Although the latency is shorter on Go trials, there is not a consistent pattern of behavior between subjects.
Fig. 3.
Fig. 3.
Placement of electrodes in nucleus accumbens (NAc). Each circle marks the location of an electrode tip from which neural activity from an individual neuron was recorded. The fill color of each circle indicates whether the neuron located at that position showed an increase (white), a decrease (black), or no (gray) significant change in response relative to baseline activity at the time of Go cue onset. Locations are based on histological markers in Paxinos and Watson (2007). NAcc, NAc core; ac, anterior commissure; NAcsh, NAc shell. Inset: donut plot shows the proportion of neurons with increasing (white, n = 43), decreasing (black, n = 22), or nonphasic (gray, n = 62) responses.
Fig. 4.
Fig. 4.
NAc neurons are differentially modulated by task events in the Go/NoGo task. A: perievent histogram (PEH) of average firing rate (sp/s, +1 SE) recorded from 127 NAc neurons is shown for all Go (green, n = 14,457) and NoGo (red, n = 5,281) trials, aligned to the onset of the cue at the beginning of each trial. Horizontal lines below the PEH indicate 0.5-s intervals during which firing rate for Go (green) and NoGo (red) trials significantly differs from the level of activity during the 4-s baseline period preceding the beginning of each trial. B: for each neuron, the change in firing rate (ΔFR) from baseline level during the first second of cue presentation was calculated separately for Go and NoGo trials. Each circle indicates a single neuron's cue response on NoGo trials as a function of its response on Go trials. Circles outlined in gray mark the neurons that did not show a significant difference in firing rate in response to the Go cue. Circles outlined in black mark neurons that did show a significant response to Go cues, whether an increase in firing rate (>0) or a decrease (<0). Neurons that had a significantly higher firing rate in response to the NoGo cue compared with the Go cue are filled in red, and neurons that had a higher firing rate in response to the Go cue compared with the NoGo cue are filled in green. The average difference across all 127 neurons was 0.21 sp/s (confidence interval = 0.09–0.33, P < 0.0001), which is consistent with A, in which there is a higher firing rate in the first second for NoGo trials compared with Go trials. The yellow arrow marks the average cue response across all neurons to the Go and NoGo cues, with the difference indicated as a deflection above the line of unity. C: average firing rate for all correct Go (green, n = 12,911) and NoGo (red, n = 4,270) trials. Horizontal red line below PEH indicates 0.5-s epochs during which the response was significantly higher on NoGo compared with Go trials. The green arrowhead indicates average RT for lever presses on correct Go trials (957 ± 14 ms), and the green plus sign indicates the average time of reward receipt for those trials (4.99 ± 0.02 s). For correct NoGo trials, in which rats did not press the lever, it retracted and reward was delivered 4.5 s after trial onset (red arrowhead and plus sign). D: average firing rate for all error Go (light green, n = 1,546) and NoGo (orange, n = 1,011) trials. Horizontal green line below PEH indicates 0.5-s epoch during which the response was significantly higher on Go trials than NoGo trials. The orange arrowhead indicates average RT for NoGo error presses (957 ± 14 ms), and the green arrowhead marks the time of lever retraction for Go trials on which rats failed to press. For both correct and error trials, the average response to cue onset was more elevated for trials in which rats withheld lever pressing compared with trials in which they pressed the lever.
Fig. 5.
Fig. 5.
Examples of single neurons with significant modulations of activity at the onset of the Go cue and lever presentation. A: NAc neuron with significantly higher activity during the 1-s epoch following Go trial onset. Top: raster plots in which each row show the time of action potentials relative to cue onset (time = 0 s) for 1 trial. All Go trials (left), both correct and error combined, are shown separately from all NoGo trials (right). Bottom: PEHs show the firing rate averaged in 100-ms bins. In this example, the NoGo cue elicited a significantly higher level of activity than the Go cue during the first second of the trial. B: NAc neuron with a significant reduction in activity in the 1-s epoch following Go trial onset. Same conventions as A. This neuron showed a significant decrease in activity in response to the cue on Go trials but was not modulated on NoGo trials.
Fig. 6.
Fig. 6.
Transient changes in NAc activity in the 1 s following cue onset were modulated by action selection. For each panel, the colored portion of the donut plot indicates the proportion of total neurons recorded represented in each subpopulation. A: 43 NAc neurons responded with a transient increase in activity when the Go cue and lever were presented to initiate each trial. Average firing rate (sp/s, +1 SE) is plotted separately for correct (dark green, n = 4,347) and error (light green, n = 509) trials. Shaded region marks the 1-s epoch used to identify neurons as increasing, and the average firing rate for this epoch is shown in inset for correct and incorrect trials. In this initial epoch, the neural response was higher for Go error trials, in which lever pressing was withheld, than for correct trials (*P < 0.05). Horizontal lines below PEHs mark 0.5-s epochs in which the response on correct trials (dark green) and errors (light green) differed from baseline level of activity. B: response of same 43 increasing neurons for NoGo correct (red) and error (orange) trials. Firing rate in the 1 s following cue onset (shaded) was higher for correct NoGo trials, in which lever pressing was withheld, than errors (inset, *P < 0.001). Horizontal lines below PEHs identify the 0.5-s epochs in which the response on correct (red, n = 1,473) and error (orange, n = 341) trials differed from baseline level of activity. C: 22 NAc neurons responded with a transient decrease in activity at the time of cue onset. Same conventions as A. Firing rate in the 1-s epoch following trial onset was reduced to significantly lower levels for correct Go trials (n = 2,257) compared with NoGo trials (n = 304) in which rats pressed the lever (*P < 0.001). D: response of same 22 decreasing neurons on correct (red, n = 745) and error (orange, n = 159) NoGo trials. Same conventions as B. Firing rate in the 1-s epoch following trial onset was reduced to significantly lower levels for correct Go trials, in which rats pressed the lever (*P < 0.01).
Fig. 7.
Fig. 7.
The lower level of average response on Go correct trials for the 127 neurons recorded is not related to RT to lever press. For each rat, correct Go trials were divided at the median RT into short- and long-RT groups. Light and dark gray traces show the average neural response for short- and long-RT correct Go trials, respectively (sp/s, +1 SE; n = 6,446 and 6,464 trials). Arrowheads below mark average RT for the 2 groups of trials (short = 510 ms, long = 1,442 ms). In the first 0.5 s of trials, there was no difference in the change in firing rate between short- and long-RT Go correct trials (Eq. 1, H0: b4 = 0, P = 0.10). However, the decline in response was steeper for correct Go trials (short and long RT combined) than for trials in which rats did not press the lever (Go error and NoGo correct combined: Eq. 2, H0: b4 = 0, P < 0.001). Linear fits from this estimation are shown in black.

References

    1. Ambroggi F, Ghazizadeh A, Nicola SM, Fields HL. Roles of nucleus accumbens core and shell in incentive-cue responding and behavioral inhibition. J Neurosci 31: 6820–6830, 2011 - PMC - PubMed
    1. Bari A, Mar AC, Theobald DE, Elands SA, Oganya KC, Eagle DM, Robbins TW. Prefrontal and monoaminergic contributions to stop-signal task performance in rats. J Neurosci 31: 9254–9263, 2011 - PMC - PubMed
    1. Basar K, Sesia T, Groenewegen H, Steinbusch HW, Visser-Vandewalle V, Temel Y. Nucleus accumbens and impulsivity. Prog Neurobiol 92: 533–557, 2010 - PubMed
    1. Blaiss CA, Janak PH. The nucleus accumbens core and shell are critical for the expression, but not the consolidation, of Pavlovian conditioned approach. Behav Brain Res 200: 22–32, 2009 - PMC - PubMed
    1. Boucher L, Palmeri TJ, Logan GD, Schall JD. Inhibitory control in mind and brain: an interactive race model of countermanding saccades. Psychol Rev 114: 376–397, 2007 - PubMed

Publication types

LinkOut - more resources