Review
. 2013 Sep;15(3):247-62.
doi: 10.31887/DCNS.2013.15.3/osporns.

Structure and function of complex brain networks

Affiliations
Review

Structure and function of complex brain networks

Olaf Sporns. Dialogues Clin Neurosci. 2013 Sep.

Abstract

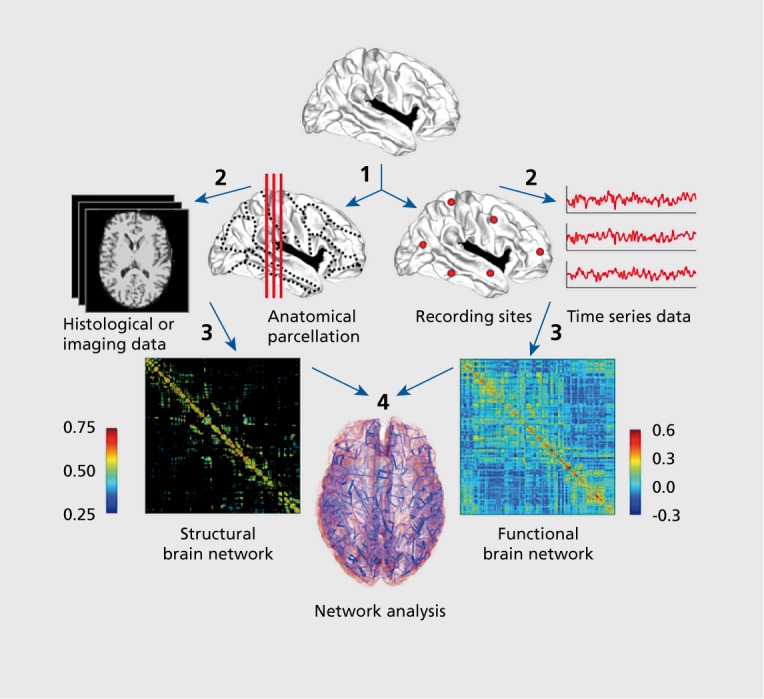
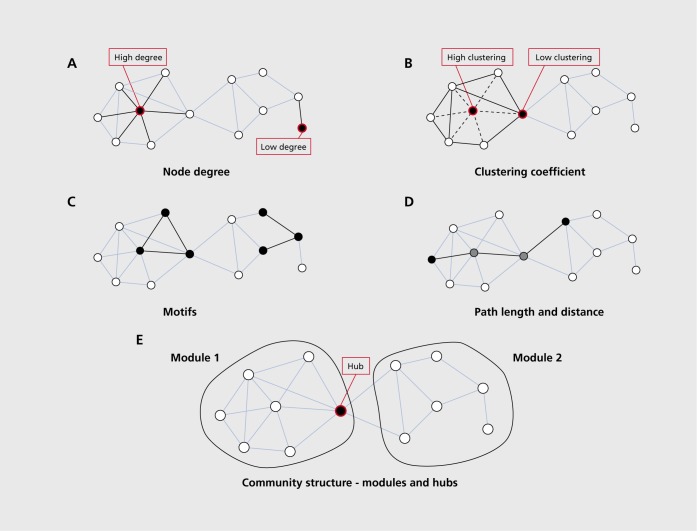
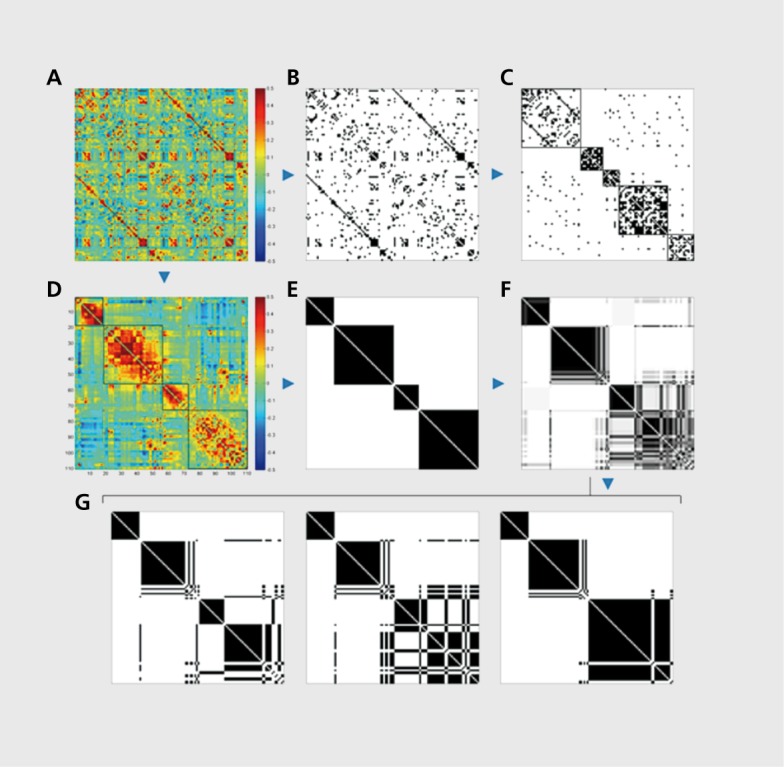
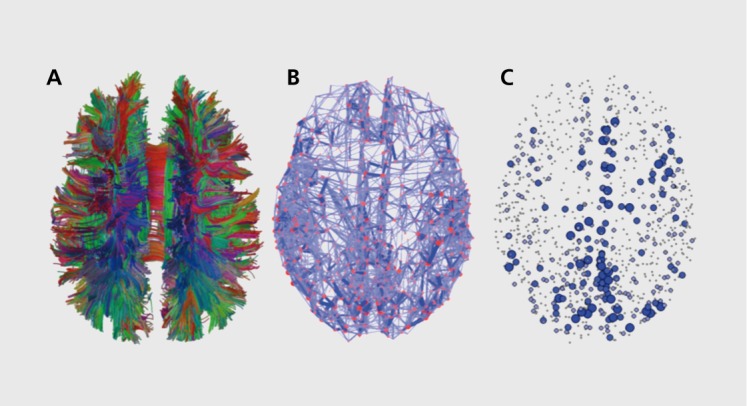
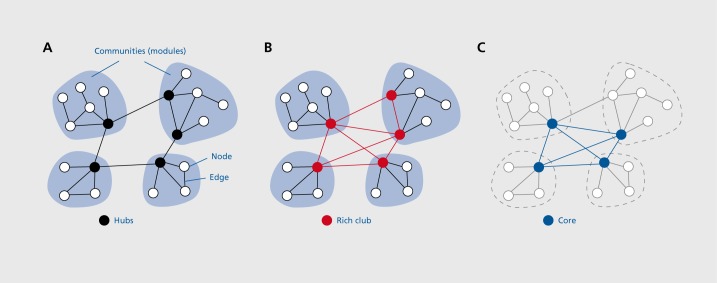
An increasing number of theoretical and empirical studies approach the function of the human brain from a network perspective. The analysis of brain networks is made feasible by the development of new imaging acquisition methods as well as new tools from graph theory and dynamical systems. This review surveys some of these methodological advances and summarizes recent findings on the architecture of structural and functional brain networks. Studies of the structural connectome reveal several modules or network communities that are interlinked by hub regions mediating communication processes between modules. Recent network analyses have shown that network hubs form a densely linked collective called a "rich club," centrally positioned for attracting and dispersing signal traffic. In parallel, recordings of resting and task-evoked neural activity have revealed distinct resting-state networks that contribute to functions in distinct cognitive domains. Network methods are increasingly applied in a clinical context, and their promise for elucidating neural substrates of brain and mental disorders is discussed.

Un creciente número de estudios teóricos y empíricos enfocan la función del cerebro humano desde una perspectiva de red. El análisis de las redes cerebrales se ha hecho posible gracias al desarrollo de nuevos métodos de obtención de imágenes, así como de nuevas herramientas provenientes de la teoría de grafos y de los sistemas dinámicos. Este artículo revisa algunos de estos avances metodológicos y resume los hallazgos recientes sobre la arquitectura de las redes cerebrales estructurales y funcionales. Los estudios del conectoma estructural revelan que existen varios módules o comunidades de redes que están vinculadas entre sí por concentradores (“hubs”) que median los procesos de comunicación entre los módules. Análisis recientes han demostrado que los concentradores de la red forman un nodo densamente interconectado denominado “club de ricos”, localizado centralmente para atraer y dispersar las señales de tránsito. En paralelo, los registros de la actividad neural en reposo y evocada por tareas han revelado distintas redes en estado de reposo que contribuyen a las funciones en diversos dominios cognitivos. Ya que los métodos de red se aplican cada vez más en el contexto clínico, se discute lo prometedor que puedan resultar estos para dilucidar los sustratos neurales de los trastornos cerebrales y mentales.

De plus en plus d'études théoriques et empiriques abordent la fonction du cerveau humain sous I'angle de réseaux. L'analyse de ces réseaux est rendue possible par le développement de nouvelles méthodes d'acquisition d'imagerie et de nouveaux outils issus de théories graphiques et de systèmes dynamiques. Cet article analyse certaines de ces avancées méthodologiques et résume les récentes découvertes sur l'architecture des réseaux cérébraux anatomiques et fonctionnels. Des études sur le connectome structurel montrent plusieurs modules ou communautés de réseaux liés par des points centraux ou centres d'activité (hubs) permettant des processus de communication entre les modules. De récentes analyses des réseaux ont montré que les centres de ces réseaux forment un collectif à forte densité de liaison appelé «club de riches», dispose centralement pour attirer et disperser la circulation du signal. Parallèlement, des enregistrements de I'activité neuronale déclenchée par le travail ou au repos ont révélé des réseaux d'état de repos distincts contribuant à des fonctions dans différents domaines cognitifs. Les modèles de réseaux sont de plus en plus appliqués dans un contexte clinique et nous analysons les perspectives qu'ils offrent pour élucider les substrats neuronaux des troubles mentaux et cérébraux.

Keywords: connectome; diffusion imaging; functional MRI; graph theory; neuroimaging; resting state; tractography.


Figures

Figure 1.
Figure 1.. Extraction of brain networks from brain measurements and recordings. The basic workflow follows four main steps. (1) Definition of network nodes, either by parcellation of the brain volume into structurally or functionally coherent regions (left), or on the basis of placement of sensors and/or recording sites (right); (2) Definition of network edges, either by estimating structural connections from structural or diffusion imaging data (left), or by processing time series data into “functional edges” that express statistical dependencies (right); (3) Network construction, by aggregating nodes and edges into a connection matrix representing a structural (left) or functional network (right). The example plots are from previously published data, (4) Network analysis. Reproduced from ref 162: Sporns 0. The human connectome: a complex network. Ann N Y Acad Sci. 2011 ; 1224: 109-125. Copyright (c) The Academy of Sciences 2011
Figure 2.
Figure 2.. Basic network metrics. For illustrative purposes, network measures are demonstrated in a rendering of a simple undirected graph with 12 nodes and 23 edges. (A) The node degree is simply the number of edges attached to a given node. (B) The clustering coefficient expresses the extent to which a node's topological neighbors are connected among themselves. Consider the “high clustering” which has a total of six neighbors. These neighbors maintain 8 out of 15 possible edges, which results in a clustering coefficient of 0.53. Another node is labeled “low clustering” since its 5 neighbors have only one mutual connection. (C) Networks can be uniquely decomposed into subgraphs of motifs. The plot shows two examples of two different classes of undirected three-node motifs. (D) The length of the shortest path corresponds to the (topological, not metric) distance between two nodes. Here, the two nodes A and B connect to each other in three steps, with a shortest path that travels through two intermediate nodes (here shown in gray). (E) The example network shown here can be decomposed into two main clusters or modules that are interconnected by a single hub node. The figure has been modified from ref 163.
Figure 3.
Figure 3.. Methodological issues in the analysis of functional connectivity. Panels (B) and (C) illustrate the effect of thresholding and binarizing. Panels (D) to (G) illustrate the issue of degenerate solutions in modularity. (A) A whole-brain functional connectivity matrix generated by averaging over approximately 1 000 participants imaged in 18 imaging centers worldwide, as part of the “1000 Functional Connectomes” dataset (F1000). Nodes are arranged according to the Harvard-Oxford Atlas (comprising 112 cortical and subcortical regions). Data are averaged and processed as described in ref 39. (B) The same matrix as shown in (A) after applying a threshold that retains only the top 10 % of all connections. The remaining connections have been binarized (set to unity strength; black squares). (C) Optimal partitioning and rearrangement of nodes according to modules. A total of five modules are found, with the majority of binary connections arranged within these modules. (D) The same matrix as shown in (A), after optimizing modularity but without thresholding. Four modules are identified, with a maximal Q = 0.4958. (E) The same matrix as in (D) but with modules indicated in a block structure. (F) Mutliple applications of the modularity optimization algorithm (here 1 000) yielded a number of unique solutions (here 47) that are displayed in the form of the consensus matrix. Different gray levels refer to the number of times each node pair was placed into the same module. While the first module appears intact across nearly all solutions, the last two modules display a complex consensus structure, suggesting that they are closely linked. (G) Three out of the 47 unique individual solutions found, with value of Q = 0.4844, Q = 0.4820, and Q = 0.4778 (left to right). Note that the last two modules have joined in the third example, and that module 1 remains intact across all three solutions.
Figure 4.
Figure 4.. From imaging structural brain connectivity to network metrics. The three plots show three different ways to represent structural connections in anatomical space. (A) A set of tractography streamlines. Red, green and blue indicate fibers running along the medial-lateral, anterior-posterior, and dorsal-ventral direction, respectively. (B) A network diagram of nodes (red) and edges (blue), with edge width indicating the edge strength, calculated as the streamline density linking each node pair. For clarity, only the strongest edges are shown. (C) A plot representing a nodal network measure, in this case the node betweenness centrality. Highly central nodes are found in medial parietal as well as cingulate and frontal cortex. Data replotted from ref 56.
Figure 5.
Figure 5.. Modules, cores, and rich clubs. (A) A schematic network composed of four modules that are linked by hub nodes (black). These hub nodes are clearly important for connecting modules to each other, but they are only weakly interconnected amongst each other. (B) With the addition of further inter-module connections hub nodes now form a densely interconnected rich club, consisting of 5 nodes with a degree of 4 or higher. (C) The same network as shown in (B), but now shown after core decomposition, (ie, the iterative removal of low degree nodes, shown here in gray). This procedure results in a core network comprising 4 nodes with a minimal degree of 3.
Figure 6.
Figure 6.. Relation of structural to functional connections. All data shown here are represent the right hemisphere of cerebral cortex (averaged over 5 participants), replotted from refs 56,95. (A) Structural connectivity (SO matrix, with edge weights resampled to a Gaussian distribution. (B) Empirical resting-state functional connectivity (FCemp), expressed as Pearson correlations of fMRI time series (average of two runs per participant, 35 minutes total length). (C) Simulated functional connectivity (FCsim) obtained using a neural mass model (average of 8 runs of 8 minutes simulated time)., (D) Correlation between SC and FCemp (R= 0.57). (E) Correlation between SC and FCsim (R = 0.51). (F) Correlation between FCemp and FCsim (R = 0.46). Correlation plots show regression lines in red, and are computed over structurally connected node pairs in panels (D) and (E), and all node pairs in panel (F).
Figure 7.
Figure 7.. The connectome as an example of an intermediate phenotype. This schematic diagram illustrates a hierarchy of brain phenotypes, ranging from molecular to behavioral scales. Variations along these scales are influences by genetic variation and environmental factors. Connectomics deals with patterns of structural connections and functional brain activity at the cellular and systems level. As such, connectomics focuses on levels where genetic and environmental factors converge. Modified from ref 165: Bullmore ET, Fletcher R Jones PB. Why psychiatry can't afford to be neurophobic. Br J Psychiatry. 2009; 194:293-295. Copyright (c) The Royal College of Psychiatrists 2009

References

    1. Friston KJ. Modalities, modes, and models in functional neuroimaging. Science. 2009;326:399–403. - PubMed
    1. Bandettini PA. Functional MRI: a confluence of fortunate circumstances. Neuroimage. 2012;61:A3–A11. - PMC - PubMed
    1. Newman MEJ. Networks. Oxford, UK: Oxford University Press. 2010
    1. Estrada E. The Structure of Complex Networks. Oxford, UK: Oxford University Press. 2012
    1. Sporns O., Chialvo D., Kaiser M., Hilgetag CC. Organization, development and function of complex brain networks. Trends Cogn Sci. 2004;8:418–425. - PubMed

Publication types

LinkOut - more resources