Review
. 2013 Sep;15(3):359-84.
doi: 10.31887/DCNS.2013.15.3/edennis.

Typical and atypical brain development: a review of neuroimaging studies

Affiliations
Review

Typical and atypical brain development: a review of neuroimaging studies

Emily L Dennis et al. Dialogues Clin Neurosci. 2013 Sep.

Abstract

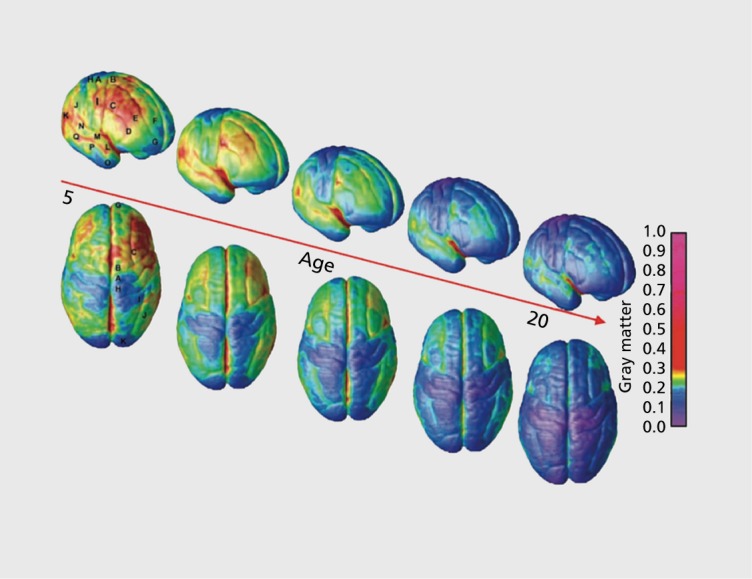
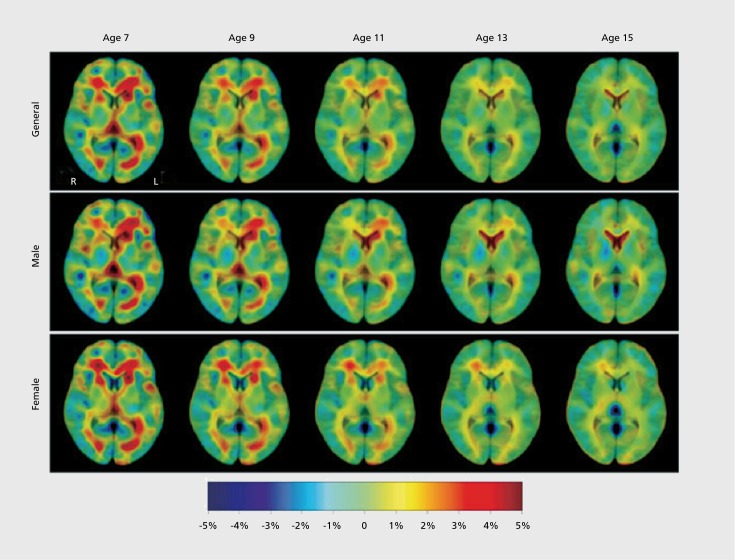
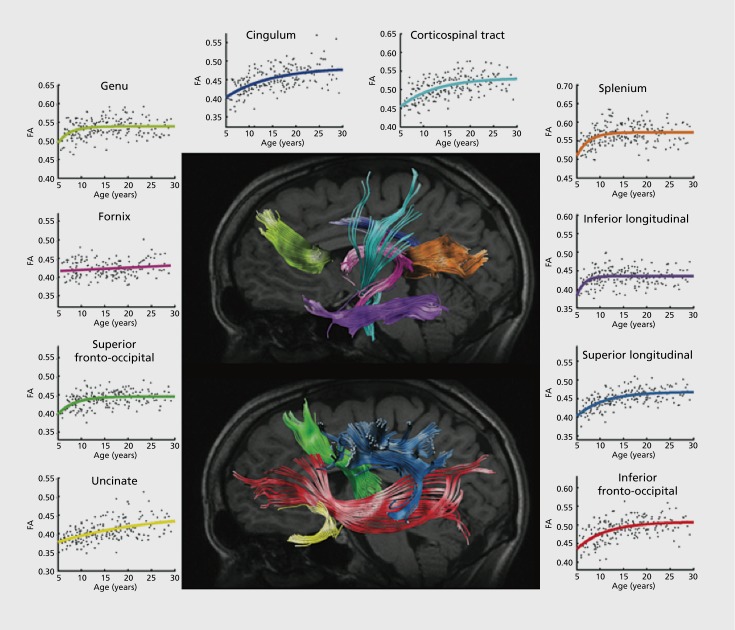
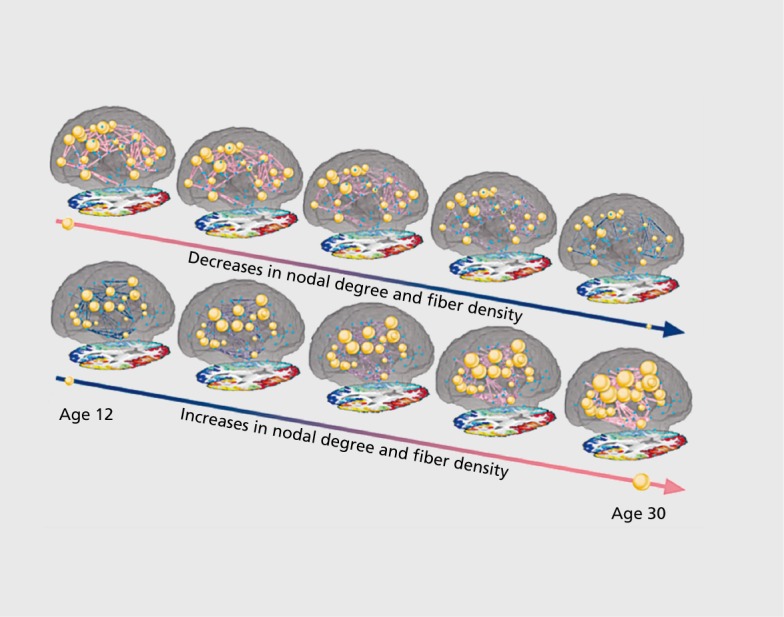
In the course of development, the brain undergoes a remarkable process of restructuring as it adapts to the environment and becomes more efficient in processing information. A variety of brain imaging methods can be used to probe how anatomy, connectivity, and function change in the developing brain. Here we review recent discoveries regarding these brain changes in both typically developing individuals and individuals with neurodevelopmental disorders. We begin with typical development, summarizing research on changes in regional brain volume and tissue density, cortical thickness, white matter integrity, and functional connectivity. Space limits preclude the coverage of all neurodevelopmental disorders; instead, we cover a representative selection of studies examining neural correlates of autism, attention deficit/hyperactivity disorder, Fragile X, 22q11.2 deletion syndrome, Williams syndrome, Down syndrome, and Turner syndrome. Where possible, we focus on studies that identify an age by diagnosis interaction, suggesting an altered developmental trajectory. The studies we review generally cover the developmental period from infancy to early adulthood. Great progress has been made over the last 20 years in mapping how the brain matures with MR technology. With ever-improving technology, we expect this progress to accelerate, offering a deeper understanding of brain development, and more effective interventions for neurodevelopmental disorders.

Le cerveau subit au cours du développement une restructuration remarquable par son adaptation à l'environnement et son efficacité croissante dans le traitement de l'information. Plusieurs méthodes de neuro-imagerie peuvent être utilisées pour mettre en évidence les modifications anatomiques, fonctionnelles et de connectivité dans le cerveau en cours de développement. Nous analysons ici les découvertes récentes sur les modifications cérébrales à la fois chez les sujets en cours de développement classique et chez ceux souffrant de troubles neurodéveloppementaux. Débutant par le développement classique, un résumé de la recherche sur les modifications du volume cérébral régional et la densité tissulaire, l'épaisseur corticale, l'intégrité de la substance blanche et la connectivité fonctionnelle, est présenté. Par manque d'espace nous ne pouvons traiter tous les troubles neurodéveloppementaux et nous avons plutôt sélectionné des études représentatives des caractéristiques neurologiques de l'autisme, du trouble déficit de l'attention/hyperactivité, de l'X fragile, du syndrome de délétion 22q11.2, du syndrome de Williams, du syndrome de Down et du syndrome de Turner. Lorsque cela est possible, nous nous intéressons aux études qui identifient une interaction âge/diagnostic, en faveur d'un trouble de la trajectoire du développement. Les études examinées couvrent généralement la période de la petite enfance à l'adulte jeune. La cartographie de la maturation cérébrale par résonance magnétique a considérablement progressé ces 20 dernières années et, la technologie s'améliorant sans cesse, nous espérons aller plus vite afin de mieux comprendre le développement cérébral et d'être plus efficaces dans les troubles neurodéveloppementaux.

Durante el curso del desarrollo el cerebro experimenta un notable proceso de reestructuración para adaptarse al ambiente y llegar a ser más eficiente en el procesamiento de la información. Se puede emplear una variedad de métodos de imágenes cerebrales para evaluar cómo cambia la anatomía, la conectividad y el funcionamiento durante el desarrollo. Se revisan los descubrimientos recientes en relación con estos cambios cerebrales en sujetos que tienen un desarrollo típico y en quienes tienen trastornos del neurodesarrollo. El artículo comienza con el desarrollo clásico, resumiendo la investigación acerca de los cambios en el volumen regional y la densidad del tejido cerebral, el espesor cortical, la integridad de la sustancia blanca y la conectividad funcional. La limitación de espacio impide cubrir todos los trastornos del desarrollo y se aborda una selección representativa de estudios que examinan los correlatos neurales en autismo, trastorno por déficit de atención/hiperactividad, Síndrome X frágil, Síndrome de deleción 22q11.2, Síndrome de Williams, Síndrome de Down y Síndrome de Turner. Cuando es posible se destacan los estudios que identifican una interacción entre la edad yel diagnóstico, lo que sugiere una alteración en el curso del desarrollo. Los estudios revisados en general cubren el período de desarrollo entre la infancia y la adultez inicial. En los últimos 20 años, con tecnología de resonancia magnética, se han realizado grandes progresos en el mapeo de cómo madura el cerebro. Se espera que con tecnologías cada vez mejores se acelere este progreso, se posibilite una comprensión más profunda del desarrollo cerebral y se puedan realizar intervenciones más efectivas para los trastornos del neurodesarrollo.

Keywords: 22q; ADHD; DTI; Down syndrome; MRI; Turner syndrome; Williams syndrome; autism; brain connectivity; brain structure; development; fragile X; neurodevelopmental disorder; rsfMRI.


Figures

Figure 1.
Figure 1.. Gray matter maturation between ages 5 and 20. The side bar shows a color representation in units of gray matter volume. Images are stills from a movie available online from ref 1: Gogtay N, Giedd JN, Lusk L, et al. Dynamic mapping of human cortical development during childhood through early adulthood. Proc Natl Acad Sci U S A. 2004;101:8174-8179. Copyright © National Academy of Sciences 2004
Supplementary Figure 1.
Supplementary Figure 1.. Gray matter maturation between ages 7-15. Tissue growth maps modeled by linear regression, for all subjects and males and females separately. Reproduced from ref 31: Hua X, Leow AD, Levitt JG, Caplan R, Thompson PM, Toga AW. Detecting brain growth patterns in normal children using tensor-based morphometry. Hum Brain Mapp. 2009;30:209-219. Copyright © Wiley-Liss 2009
Figure 2.
Figure 2.. White matter maturation between ages 5 and 30. Age-related fractional anisotropy increases measured by tractography in 202 individuals across 10 tracts. Reproduced from ref 48: Lebel C, Walker L, Leemans A, Phillips L, Beaulieu C. Microstructural maturation of the human brain from childhood to adulthood. Neurolmage. 2008;40:1044-1055. Copyright © Elsevier 2008
Figure 3.
Figure 3.. Development of structural connectivity between age 12 and age 30. Still images from videos available online from ref 55 displaying the increases and decreases in degree and fiber density between age 12 and age 30. For this image, node size is proportional to the degree (number of connections), and connection thickness is proportional to relative fiber density. The connection color is simulated to make the connections easier to see. The rate of increase or decrease for each node and connection was the regression coefficients from the age analyses for those nodes and connections. Small blue dots indicate nodes for which there was no significant age-related increase or decrease in degree. Only connections that had a significant age-related increase or decrease in fiber density are included in this image, other connections exist but are not drawn in for clarity. In this image are both weighted (fiber density) and binary (degree) measures. These images are created from the results when analyses were restricted to only connections existing in at least 95% of subjects. Reproduced from ref 52. Dennis EL, Jahanshad N, McMahon KL, et al. Development of brain structural connectivity between ages 12 and 30: a 4-Tesla diffusion imaging study in 439 adolescents and adults. Neurolmage. 2013;64:671-684. Copyright © Elsevier 2013
Figure 4.
Figure 4.. Development of functional connectivity. Voxelwise resting-state functional connectivity maps for a seed region (solid black circle) in medial prefrontal cortex—mPFC (ventral: -3, 39, -2). (A) Qualitatively, the resting-state functional connectivity MRI (rs-fcMRI) map for the mPFC (ventral) seed region reveals the commonly observed adult connectivity pattern of the default network. The connectivity map in children, however, significantly deviates from that of the adults. Functional connections with regions in the posterior cingulate and lateral parietal regions (highlighted with blue open circles) are present in the adults but absent in children. (B) These qualitative differences between children and adults are confirmed by the direct comparison (random effects) between adults and children. mPFC (ventral) functional connections with the posterior cingulate and lateral parietal regions are significantly stronger in adults than children. Reproduced from ref 60: Fair DA, Cohen AL, Dosenbach NUF, et al. The maturing architecture of the brain's default network. Proc Natl Acad Sci U S A. 2008;105:4028-4032. Copyright © National Academy of Sciences 2008
Figure 5.
Figure 5.. Differences in white matter integrity in autism. Tract-based spatial statistics revealed regions of reduced fractional anisotropy in children with autism spectrum disorder compared with the typically developing group. Red color symbolizes significant voxels at P<.05 (corrected for multiple comparisons at cluster level). Mean skeleton of detected fiber tracts is overlaid in green on standard T1-weighted anatomical image), ilf, inferior longitudinal fasciculus; ifo, inferior fronto-occipital fasciculus; slf, superior longitudinal fasciculus; cs, corticospinal tract; cing, cingulum; bcc, body of corpus callosum; gcc, genu of corpus callosum; sec, splenium of corpus callosum; aic, anterior internal capsule; pic, posterior internal capsule; fmajor, forceps major; acr, anterior corona radiata; scr, superior corona radiata; atr, anterior thalamic radiation Reproduced from ref 79: Shukla DK, Keehn B, Lincoln AJ, Muller RA. White matter compromise of callosal and subcortical fiber tracts in children with autism spectrum disorder: a diffusion tensor imaging study. J Am Acad Child Adolesc Psychiatry. 2010;49:1269-1278.e2. Copyright © Elsevier 2010
Figure 6.
Figure 6.. Functional connectivity in autism. Bilateral amygdala connectivity. (A) The Harvard-Oxford bilateral amygdala (25% probability) used as seed region and displayed on the 1 mm MNI152 T1 standard brain. (B) Typically developing (TD) within-group connectivity maps, (C) Autism spectrum disorder within-group connectivity maps, and (D) direct between-group contrasts rendered on the Inflated PALS B12 brain using CARET (Computerized Anatomical Reconstruction and Editing Toolkit) and on the 1 mm Montreal Neurological Institute (MNI)152 T1 standard brain using Analysis of Functional Neurolmages. Maps are thresholded at Z > 2.3 (P< 0.01) with correction for multiple comparisons applied at the cluster level (P< 0.05). Red circles highlight areas of greater positive connectivity with the seed region for the TD group. Blue circles highlight areas of greater negative connectivity with the seed region for the TD group. The original paper also details the connectivity of the right inferior frontal gyrus, pars opercularis. Adapted from ref 91: Rudie JD, Shehzad Z, Hernandez LM, et al. Reduced functional integration and segregation of distributed neural systems underlying social and emotional information processing in autism spectrum disorders. Cereb Cortex. 2012;22:1025-1037. Copyright © Oxford University Press 2012
Supplementary Figure 2.
Supplementary Figure 2.. Compromised white matter integrity in attention deficit-hyperactivity disorder (ADHD). Regions of significant differences between adolescents with ADHD and controls shown in coronal, axial and sagittal views from the tract-based spatial statistics analysis. The white matter skeleton used in this analysis is displayed in yellow. Regions in which children with ADHD had higher fractional anisotropy (FA) are shown in red. Regions in which children with ADHD had higher axial diffusivity (AD) values than controls are shown in light blue. Group differences were “thickened” for visualization purposes, shown in red and blue for FA and AD respectively (ie, lighter colors represent the actual skeleton and the darker colors are the areas that were “thickened”). The bottom right panel of the figure shows the frontostriatal mask used in the analysis. Reproduced from ref 109: Tamm L, Bamea-Goralv N, Reiss AL. Diffusion tensor imaging reveals white matter abnormalities in Attention-Deficit/Hyperactivity Disorder. Psychiatry Res: Neuroimage. 2012;202:150-154. Copyright © Elsevier 2012
Figure 7.
Figure 7.. Differences in regional brain volume in fragile X. A: Regions showing significant differences in regional gray matter (GM) volume and white matter (WM) volume between fragile X syndrome (FXS) and idiopathic autism (iAUT) (panel A), FXS and typically developing (TD) and idiopathic developmentally delayed (DD) controls (panel B), and iAUT and TD/DD controls (panel C). The left side shows the right hemisphere. The statistical threshold is set at P=0.01 , familywise error cluster-level corrected. Montreal Neurological Institute coordinates. Adapted from ref 118: Hoeft F, Walter E, Lightbody A, et al. Neuroanatomies! differences in toddler boys with fragile X syndrome and idiopathic autism. Arch Gen Psychiatry. 2011;68:295-305. Copyright © American Medical Association 2011
Supplementary Figure 3.
Supplementary Figure 3.. Differences in cortical thickness in 22q11.2 DS. Using repeated-measures with the longitudinal subsample, they confirm the different trajectories of cortical thickness changes observed with cross-sectional design. 122 In preadolescents (before 9 of age at Time 1), they observe numerous clusters where no thickness changes occur in patients, whereas thinning is observed in controls. In clusters A to D, this pattern of delayed thinning reaches significance at a threshold of P< 0.007. Contrarily, they observed greater thickness loss in affected adolescents compared with controls (older than 9 at Time 1). This greater thinning with age in patients compared with controls is significant at P< 0.002. Reproduced from ref 122: Schaer M, Debbane M, Cuadra MB, et al. Deviant trajectories of cortical maturation in 22q11.2 deletion syndrome (22q11DS): Across-sectional and longitudinal study. Schizophr Res. 2009;115:182-90. Copyright © Elsevier 2009
Figure 8.
Figure 8.. (opposite) Compromised white matter integrity in Williams syndrome (WS). Voxel-based comparison of fractional anisotropy (FA) in WS compared with norma! controls. Overlay of regions of significantly increased (warm colors) and reduced (cool colors) FA in WS compared with controls on coronal slices of the average FA template in Talairach space (images displayed according to radiological convention, ie, the left hemisphere is shown on the right). Reproduced from ref 145: Arlinghaus LR, Thornton-Wells TA, Dykens EM, Anderson AW. Alterations in diffusion properties of white matter in Williams syndrome. Magn Res Imaging. 2011;29:1165-1174. Copyright © Elsevier 2011
Supplementary Figure 4.
Supplementary Figure 4.. Differences in white matter and gray matter in Turner syndrome (TS). Superimposed results of voxels showing significant fractional anisotropy (FA) reduction in the tract-based spatial statistics (TBSS) and voxel-based morphometry (VBM) clusters showing significant white matter volume (WMV) differences between the groups (P< 0.05, familywise error rate corrected). Group differences in TBSS were “thickened” (for visualization purposes) by expanding the significant white matter skeleton cluster to the full extent of the local FA map. 1) FA reduction in TS relative to controls (CON) is shown in red-yellow. 2) Greater WMV in TS relative to CON is shown in green. 3) Reduced WMV in TS relative to CON is shown in blue. Results are mapped onto a standard T1 -weighted Montreal Neurological Institute 152 template. Reproduced from ref 160: Yamagata B, Barnea-Goraly N, Marzelli MJ, et al. White matter aberrations in prepubertal estrogen-naive girls with monosomic Turner syndrome. Cereb Cortex. 2012;22:2761-2768. Copyright © Oxford University Press 2012

Similar articles

Cited by

References

    1. Gogtay N., Giedd JN., Lusk L., et al Dynamic mapping of human cortical development during childhood through early adulthood. Proc Natl Acad Sci U S A. 2004;101:8174–8179. - PMC - PubMed
    1. Huttenlocher PR., Dabholkar AS. Regional differences in synaptogenesis in human cerebral cortex. J Comp Neurol. 1997;387:167–178. - PubMed
    1. Blakemore S-J., Choudhury S. Development of the adolescent brain: implications for executive function and social cognition. J Child Psychol Psychiatry. 2006;47:296–312. - PubMed
    1. Thomason ME., Dassanayake MT., Shen S., et al Cross-hemispheric functional connectivity in the human fetal brain. Sci Transl Med. 2013;5:173ra24. - PMC - PubMed
    1. Hedman AM., Van Haren NEM., Schnack HG., Kahn RS., Hulshoff Pol HE. Human brain changes across the life span: a review of 56 longitudinal magnetic resonance imaging studies. Hum Brain Mapp. 2012;33:1987–2002. - PMC - PubMed