. 2013 Oct 29:2:e01098.
doi: 10.7554/eLife.01098.

Growth hormone-releasing hormone disruption extends lifespan and regulates response to caloric restriction in mice

Affiliations

Growth hormone-releasing hormone disruption extends lifespan and regulates response to caloric restriction in mice

Liou Y Sun et al. Elife. .

Abstract

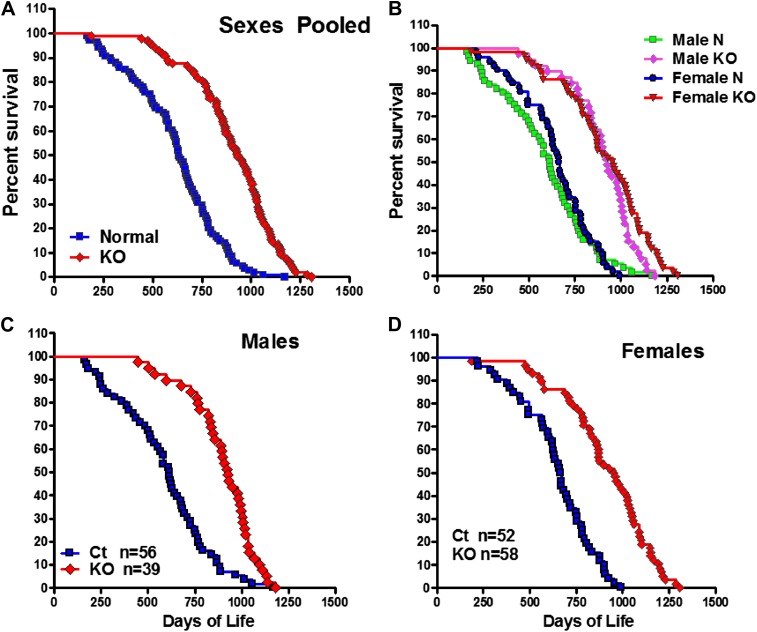
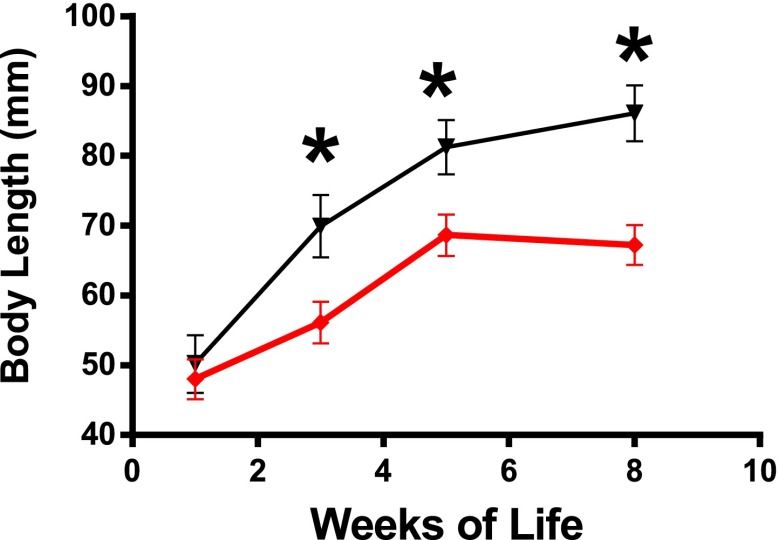
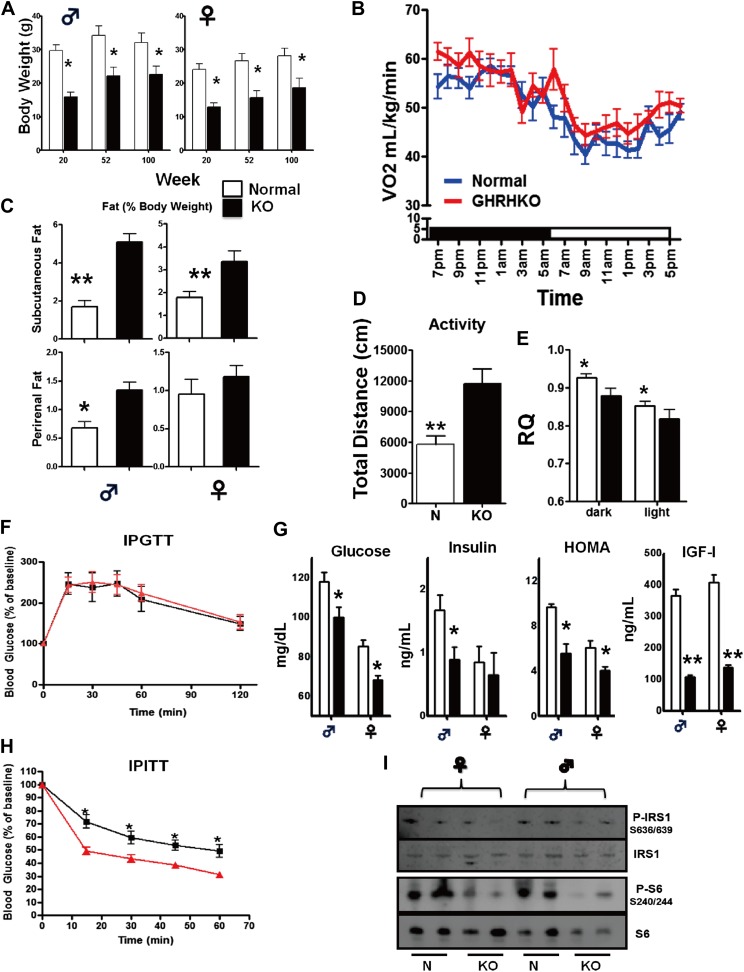
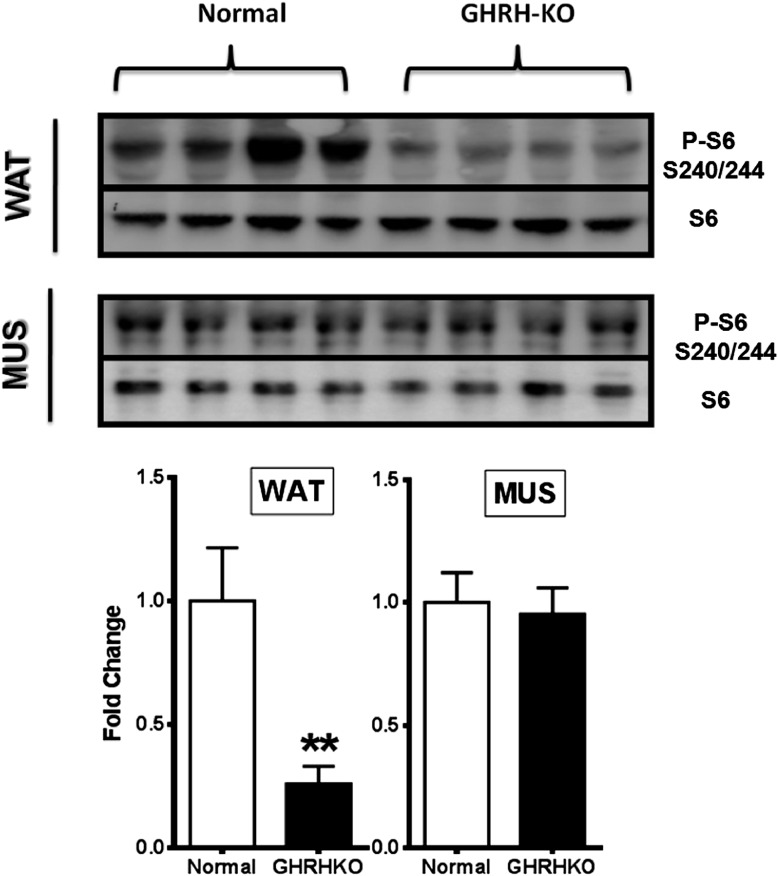
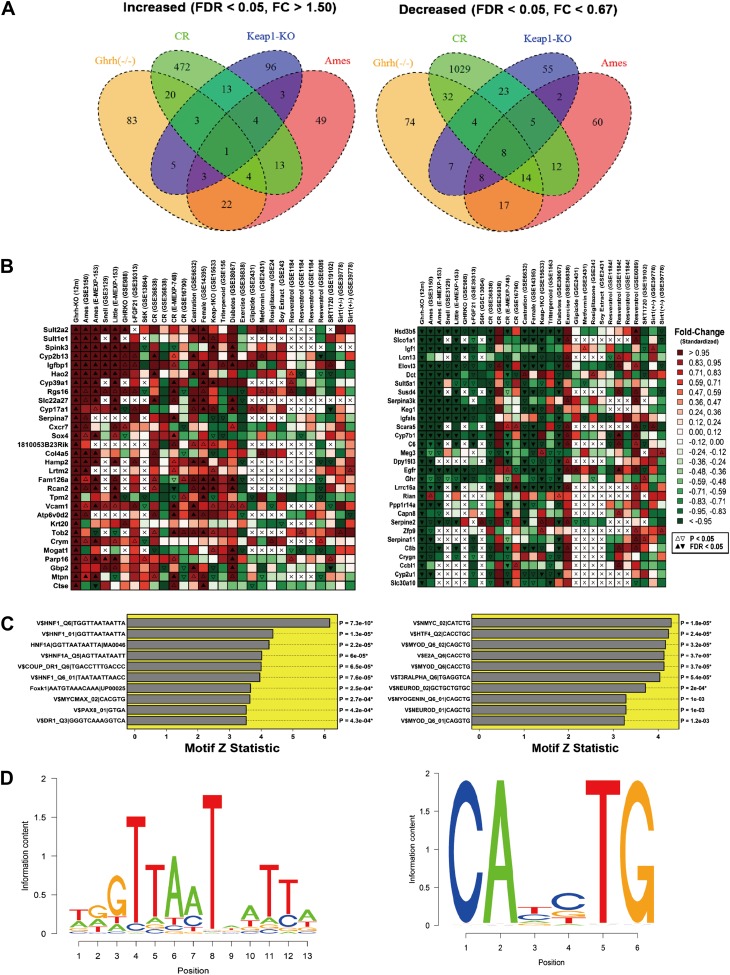
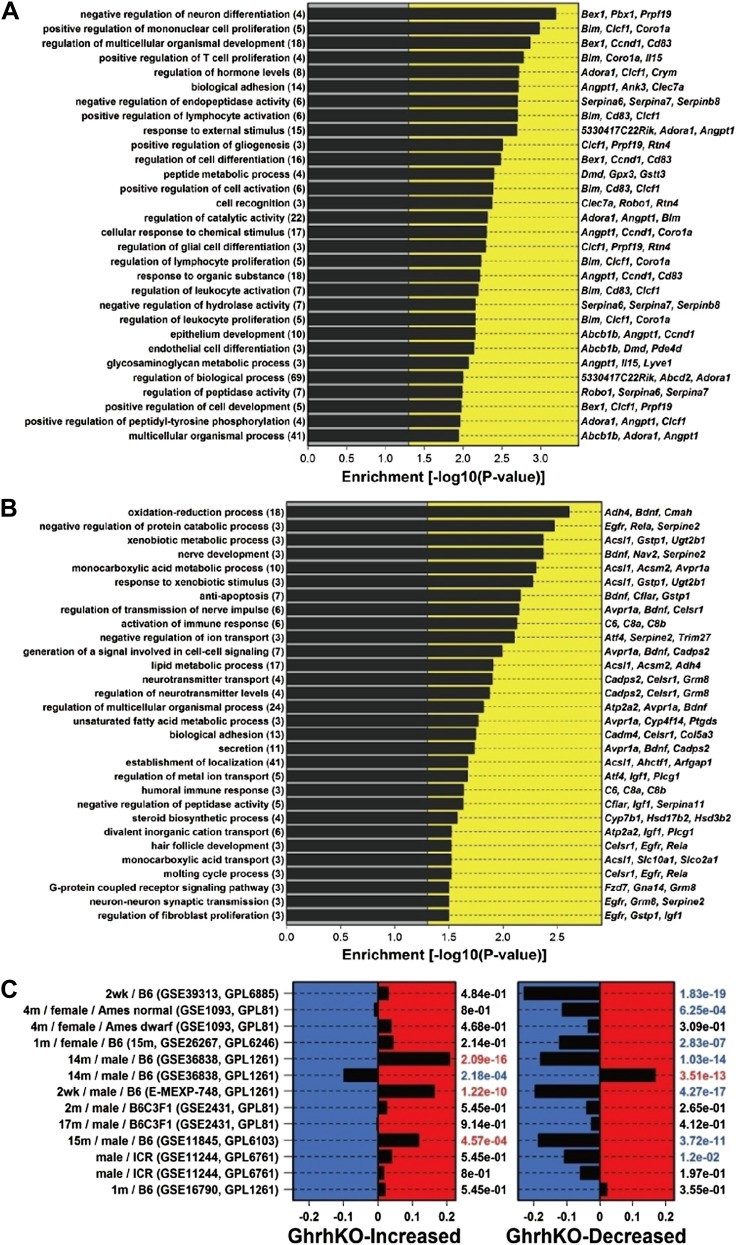
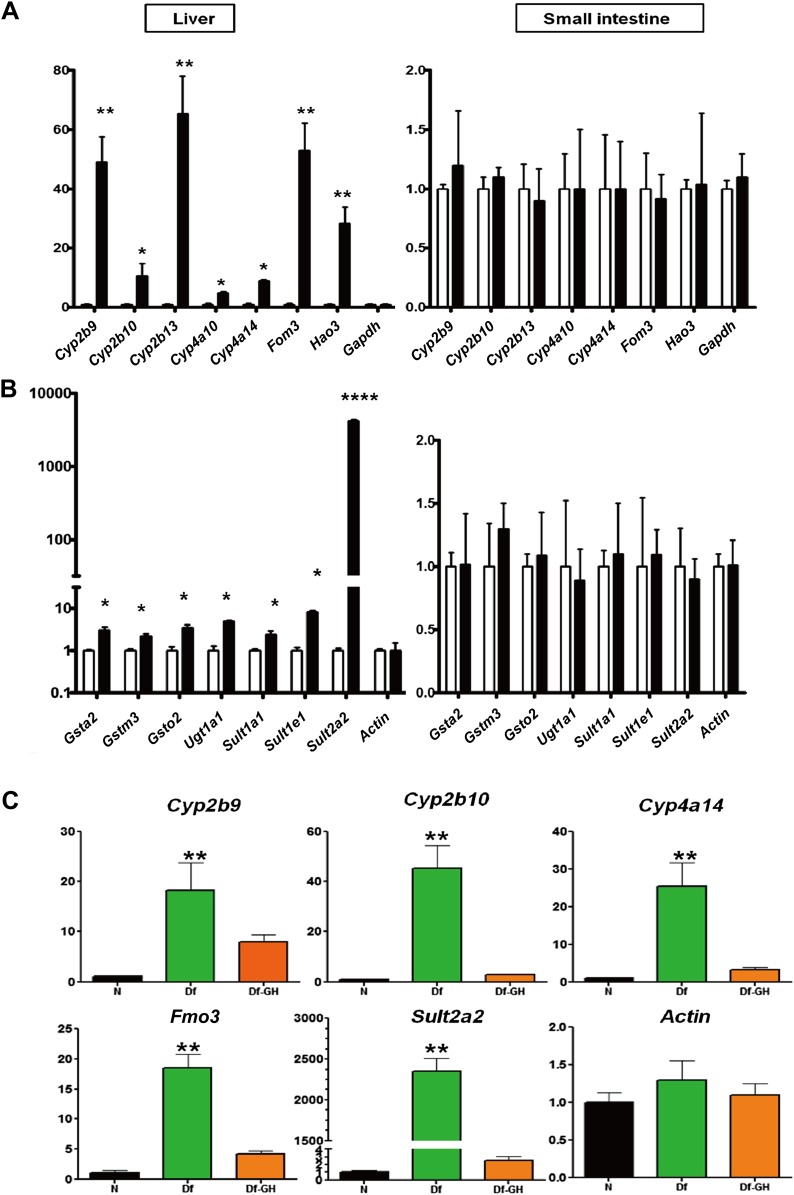
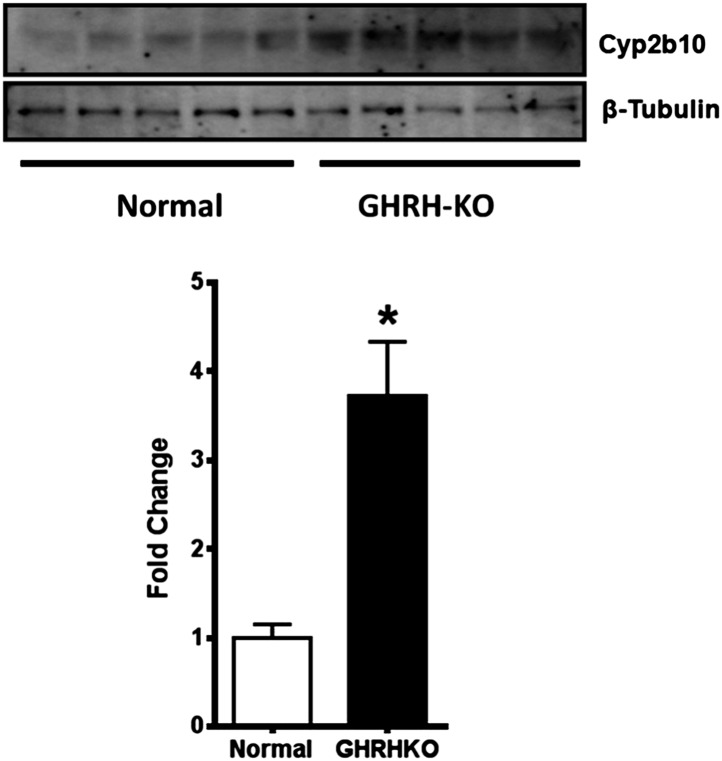
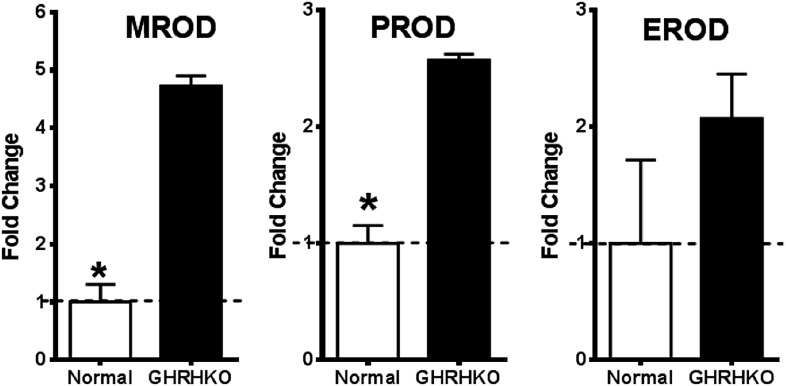
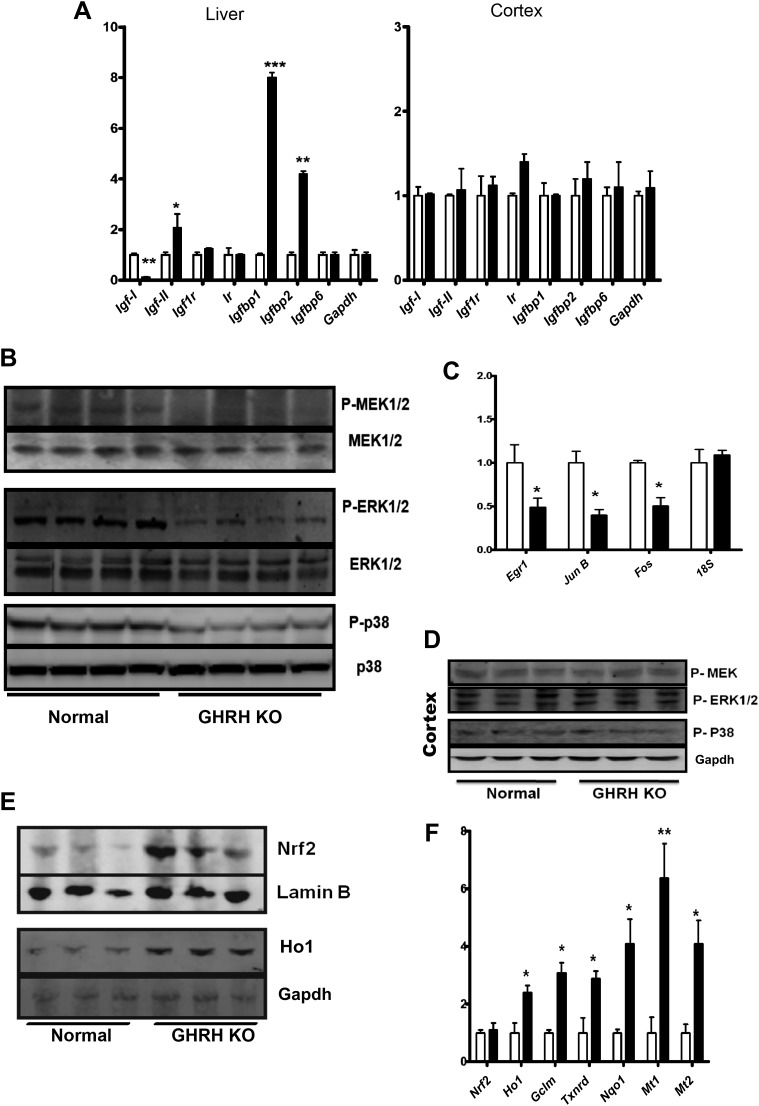
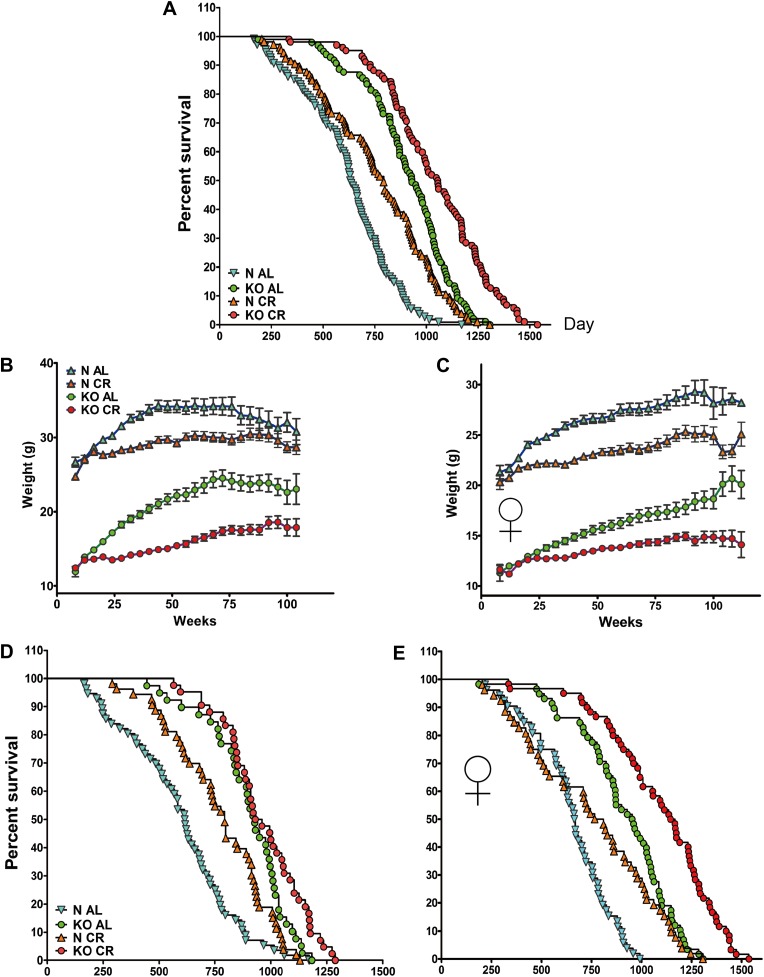
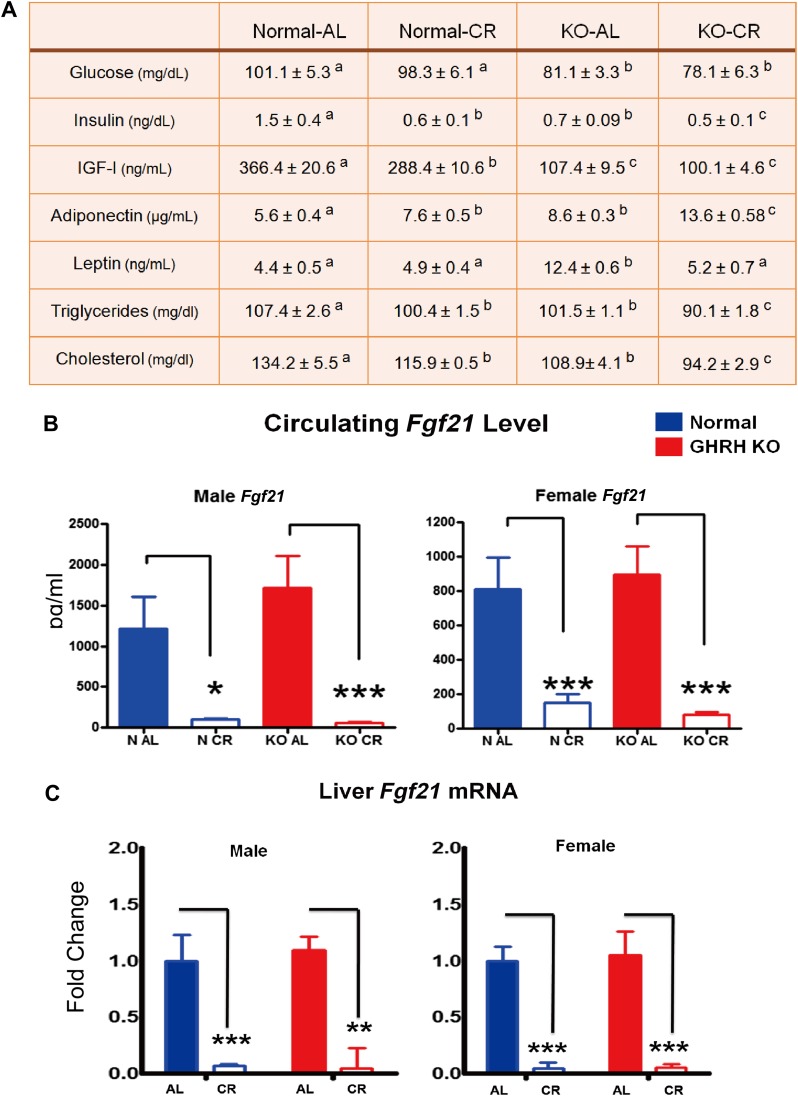
We examine the impact of targeted disruption of growth hormone-releasing hormone (GHRH) in mice on longevity and the putative mechanisms of delayed aging. GHRH knockout mice are remarkably long-lived, exhibiting major shifts in the expression of genes related to xenobiotic detoxification, stress resistance, and insulin signaling. These mutant mice also have increased adiponectin levels and alterations in glucose homeostasis consistent with the removal of the counter-insulin effects of growth hormone. While these effects overlap with those of caloric restriction, we show that the effects of caloric restriction (CR) and the GHRH mutation are additive, with lifespan of GHRH-KO mutants further increased by CR. We conclude that GHRH-KO mice feature perturbations in a network of signaling pathways related to stress resistance, metabolic control and inflammation, and therefore provide a new model that can be used to explore links between GHRH repression, downregulation of the somatotropic axis, and extended longevity. DOI:http://dx.doi.org/10.7554/eLife.01098.001.

Keywords: Mouse; aging; caloric restriction; growth hormone; mice.


Conflict of interest statement

The authors declare that no competing interests exist.

Figures

Figure 1.
Figure 1.. Increased longevity of GHRH-KO mice.
Kaplan-Meier survival curves for each genotype: GHRH-KO (KO) and Control (Ct) mice; each point represents a single mouse. (A) Sex pooled survival curves. (B) Sex separated survival curves. (C) Male survival curves (N = 56 for controls, N = 39 for KO). (D) Female survival curves (N = 52 for controls, N = 58 for KO). DOI: http://dx.doi.org/10.7554/eLife.01098.003
Figure 1—figure supplement 1.
Figure 1—figure supplement 1.. Changes in body length of GHRH-KO mice (Red) and WT control mice (Black) from 1 to 8 weeks of age.
Each point represents the mean ± SEM of 14 mice per group. *p<0.001. DOI: http://dx.doi.org/10.7554/eLife.01098.004
Figure 2.
Figure 2.. Physiological characteristics.
(A) Body weight. (B) Respiratory exchange ratio (VCO2/VO2). (C) Fat content presented as an absolute values and percentage of body weight. (D) Physical activity. (E) RQ values plotted as 12-hr averages representing either dark or light periods on both fed and fasted days. RQ = respiratory quotient; (F) Glucose tolerance test (IPGTT). 16 hr-fasted mice underwent GTT by intraperitoneal (i.p.) injection with 1 g glucose per kg of BW. (G) Fasted glucose, plasma insulin, homeostatic model for assessment of insulin resistance (HOMA-IR) and IGF-I levels. (H) Insulin tolerance test (IPITT). Mice were i.p. injected with 1 IU porcine insulin per kg of BW. (I) Representative immunoblot of the indicated proteins from liver lysates. Each lane corresponds to a different mouse. For graph B,D,E,F,H, only data from male mice were shown. N = 8–10/group; each bar represents means ± SEM for 8–10 mice of each group. *p<0.05, **p<0.01, ***p<0.001. DOI: http://dx.doi.org/10.7554/eLife.01098.005
Figure 2—figure supplement 1.
Figure 2—figure supplement 1.. Phosphorylation of S6 in the white adipose tissue (WAT) and muscle (MUS) of GHRH-KO and normal (little-mate control) mice.
Upper panels: representative images of Western blots for phosphorylated and total forms of S6 protein in GHRH-KO and control mice. Lower panels: quantification of results of Western blots, as means ± SE for eight mice of each genotype. Values represent ratios of phosphoprotein to total protein for each enzyme, relative to the value in the control mice (with normal mice set at 1). *p<0.05; **p<0.01. DOI: http://dx.doi.org/10.7554/eLife.01098.006
Figure 3.
Figure 3.. Hepatic gene expression profiles in GHRH-KO mice.
Microarray analysis was used to identify 141 genes with increased expression in GHRH-KO liver tissue (FDR < 0.05 and FC > 0.05) and 164 genes with decreased expression in GHRH-KO liver (FDR < 0.05 and FC > 0.05). (A) Venn diagram showing overlap of increased and decreased genes with sets of genes similarly altered in hepatic tissue of CR-fed mice, mice with a liver-specific Keap-1 mutation, and long-lived Ames dwarf mice. The same Affymetrix platform was used in each experiment (Mouse Genome 430 2.0 array). (B) Genes most strongly increased in GHRH mice (left) and genes most strongly decreased in GHRH mice (right). For comparison, heatmap colors show the fold change for each gene in other mutant mouse models and mice provided various treatments (e.g., CR, resveratrol, etc). Liver tissue was evaluated in all cases. (C) Top ranked motifs enriched in 2 kb regions upstream of GHRH-KO-increased genes (left) and GHRH-KO-decreased genes (right). Asterisk symbols denote those motifs remaining significant following FDR-adjustment for multiple testing among the 1291 binding sites included within our motif dictionary. (D) Sequence logos for the top-ranked motif among GHRH-KO-increased genes (left, V$HNF1_Q6|TGGTTAATAATTA) and the top ranked motif among GHRH-KO-decreased genes (right, V$NMYC_02|CATCTG). DOI: http://dx.doi.org/10.7554/eLife.01098.007
Figure 3—figure supplement 1.
Figure 3—figure supplement 1.. Characterization of genes altered in GHRH-KO mice.
(A) Top-ranked gene ontology (GO) biological process (BP) terms overrepresented among GHRH-KO-increased genes. We identified 141 genes elevated in GHRH-KO mice as compared to normal controls (FC > 1.50 and FDR < 0.05). The chart lists GO BP terms most significantly overrepresented among these 141 genes (p<0.05; conditional hypergeometric test). The number of GHRH-KO-increased genes associated with each GO BP term is listed in parentheses. The right margin lists example GHRH-KO-increased genes associated with each GO BP term. (B) Top-ranked gene ontology (GO) biological process (BP) terms overrepresented among GHRH-KO-decreased genes. We identified 164 genes decreased in GHRH-KO mice as compared to normal controls (FC < 0.67 and FDR < 0.05). The chart lists GO BP terms most significantly overrepresented among these 164 genes (p<0.05; conditional hypergeometric test). The number of GHRH-KO-decreased genes associated with each GO BP term is listed in parentheses. The right margin lists example GHRH-KO-decreased genes associated with each GO BP term. (C) Comparison between the transcriptional effects of the GHRH-KO mutation and caloric restriction (CR). We identified 141 genes elevated in GHRH-KO mice (FC > 1.50 and FDR < 0.05) along with 164 genes decreased in GHRH-KO mice (FC < 0.67 and FDR < 0.05). We further identified 13 experiments in which microarrays were used to evaluate the effects of CR in mice (left margin). Enrichment of the 141 GHRH-KO-increased genes was evaluated with respect to each of the CR experiments (left panel). Positive enrichment statistics indicate that GHRH-KO-increased genes tend to be CR-increased, while negative statistics indicate that GHRH-KO-increased genes tend to be CR-decreased. Enrichment p values are listed in the right margin (Wilcoxon rank sum test). Similarly, enrichment of the 164 GHRH-KO-decreased genes was evaluated with respect to each of the CR experiments (right panel). Positive enrichment statistics indicate that GHRH-KO-decreased genes tend to be CR-increased, while negative statistics indicate that GHRH-KO-decreased genes tend to be CR-decreased. Enrichment p values are listed in the right margin (Wilcoxon rank sum test). For each CR experiment, the left margin lists the duration of CR, the sex of the mice, and the mouse genotype (when information is available). The Gene Expression Omnibus (GEO) or Array Express accession identifier is listed in parentheses, along with the GEO array platform identifier. (Note: GPL1261 corresponds to the Affymetrix Mouse 430 2.0 Genome Array, which is the platform we used to measure gene expression in GHRH-KO mice). DOI: http://dx.doi.org/10.7554/eLife.01098.008
Figure 4.
Figure 4.. Alteration in Xenobiotic detoxification genes.
(A) Expression of phase I xenobiotic metabolism levels in liver and small intestine of KO and control mice. (B) Expression of phase II xenobiotic genes. (C) GH replacement effects on hepatic xenobiotic gene expression in GH deficient Ames dwarf mice (df) and littermates. mRNA was measured using real-time RT-PCR. Data normalized to Gapdh or actin values and were expressed as a ratio (fold change) to levels of mRNA in control mice. Bars indicate mean ± SEM for male KO or df and age-matched control male mice. N = 8 mice per group; *p<0.05, **p<0.01, ***p<0.001. DOI: http://dx.doi.org/10.7554/eLife.01098.009
Figure 4—figure supplement 1.
Figure 4—figure supplement 1.. Cyp2b10 protein expression is elevated in GHRH-KO mouse liver tissue.
(Upper panel) Representative immunoblots of Cyp2b10 and β-tubulin total protein expression are shown. (Lower panel) The means and SEM of Cyp2b10 expression were normalized to β-tubulin levels (n = 5; *p<0.05). DOI: http://dx.doi.org/10.7554/eLife.01098.010
Figure 4—figure supplement 2.
Figure 4—figure supplement 2.. Increased cytochrome P450 activity in the liver of GHRH-KO mice.
Change in resorufin formation per minute was measured in liver microsomes by fluorescence spectrophotometry. Elevations in the rate of methoxyresorufin (MROD), pentoxyresorufin (PROD) and ethoxyresorufin (EROD) formation were observed in GHRH-KO mice when compared with controls. (n = 4; *p<0.05). DOI: http://dx.doi.org/10.7554/eLife.01098.011
Figure 5.
Figure 5.. Stress signaling pathways.
(A) Expression of IGF family related mRNA levels in the liver and cortex of GHRH-KO and control mice using real-time RT-PCR. Data are normalized to Gapdh values and expressed as a ratio to the level seen in control mice. Each bar represents means ± SEM for eight mice of each genotype, *p<0.05, **p<0.01, ***p<0.001. (B) Representative autoradiographs of Western blots for phosphorylated and total forms of MEK, ERK1/2 and P38 protein in liver lysates of KO and control mice. Each lane corresponds to a different mouse. (C) Expression of Egr1, Jun and Fos mRNA levels in the liver KO and control mice. Data are normalized to 18S values and expressed as a ratio to the level seen in control mice. (D) Representative immunoblot of the indicated proteins from cortex lysates. (E) Representative autoradiographs of Western blots detecting nuclear accumulation of Nrf2 and Ho1 in the cytoplasm from liver lysates. Gapdh was the cytoplasmic marker and Lamin B was the nuclear marker. Each lane corresponds to a different mouse. (F) Expression of Nrf2-dependent mRNA levels in the liver KO and control mice by mRNA Q-PCR. Data are normalized to Gapdh values and expressed as a ratio (fold change) to the level seen in control mice. N = 8 male mice per group; *p<0.05, **p<0.01, ***p<0.001. DOI: http://dx.doi.org/10.7554/eLife.01098.012
Figure 6.
Figure 6.
Lifespan and growth curve in response to long-term CR. (A) Kaplan–Meier survival plot of GHRH-KO (KO) and Control mice (N) that were fed AL or subjected to long-term CR (Sex pooled); N-AL (N = 108), N-CR (N = 105), KO-AL (N = 97) and KO-CR (N = 102). Time course of changes in body weight for male (B) and female (C) GHRH-KO and control mice that were fed AL or subjected to CR. Animals were weighed weekly starting at 4 weeks of age. (D) Kaplan–Meier survival plot of male KO and Control mice that were fed AL or subjected to long-term CR; N-AL (N = 56), N-CR (N = 53), KO-AL (N = 39) and KO-CR (N = 42). (E) Survival plot of female KO and Control mice; N-AL (N = 52), N-CR (N = 52), KO-AL (N = 58) and KO-CR (N = 60). DOI: http://dx.doi.org/10.7554/eLife.01098.013
Figure 7.
Figure 7.. Blood parameters alteration in response to CR.
(A) Various plasma parameters from GHRH-KO and Control male mice subjected to caloric restriction. Different superscripts denote significant difference at p<0.05. Data represent the means ± SEM. (B) Circulating levels of Fgf21. (C) Hepatic Fgf21 mRNA levels. Data normalized to Gapdh or actin values and were expressed as a ratio to levels of mRNA in control mice. Bars indicate mean ± SEM. N = 8 mice per group; *p<0.05, **p<0.01, ***p<0.001. DOI: http://dx.doi.org/10.7554/eLife.01098.014
Figure 4—figure supplement 1.
Figure 4—figure supplement 1.. Hepatic FGF4R and β-Klotho mRNA levels.
Data normalized to GAPDH values and were expressed as a ratio (fold change) to levels of mRNA in control mice. Bars indicate mean ± SEM N = 8 mice per group. DOI: http://dx.doi.org/10.7554/eLife.01098.015

References

    1. Alba M, Salvatori R. 2004. A mouse with targeted ablation of the growth hormone-releasing hormone gene: a new model of isolated growth hormone deficiency. Endocrinology 145:4134–43. 10.1210/en.2004-0119 - DOI - PubMed
    1. Amador-Noguez D, Dean A, Huang W, Setchell K, Moore D, Darlington G. 2007. Alterations in xenobiotic metabolism in the long-lived Little mice. Aging Cell 6:453–70. 10.1111/j.1474-9726.2007.00300.x - DOI - PMC - PubMed
    1. Amador-Noguez D, Yagi K, Venable S, Darlington G. 2004. Gene expression profile of long-lived Ames dwarf mice and Little mice. Aging Cell 3:423–41. 10.1111/j.1474-9728.2004.00125.x - DOI - PubMed
    1. Anwar-Mohamed A, Degenhardt OS, El Gendy MA, Seubert JM, Kleeberger SR, El-Kadi AO. 2011. The effect of Nrf2 knockout on the constitutive expression of drug metabolizing enzymes and transporters in C57Bl/6 mice livers. Toxicol In Vitro 25:785–95. 10.1016/j.tiv.2011.01.014 - DOI - PubMed
    1. Bartke A. 2011. Single-gene mutations and healthy ageing in mammals. Philos Trans R Soc Lond B Biol Sci 366:28–34. 10.1098/rstb.2010.0281 - DOI - PMC - PubMed

Publication types