. 2013;15(5):R102.
doi: 10.1186/bcr3569.

Obesity associated alterations in the biology of adipose stem cells mediate enhanced tumorigenesis by estrogen dependent pathways

Obesity associated alterations in the biology of adipose stem cells mediate enhanced tumorigenesis by estrogen dependent pathways

Amy L Strong et al. Breast Cancer Res. 2013.

Abstract

Introduction: Obesity has been associated with increased incidence and mortality of breast cancer. While the precise correlation between obesity and breast cancer remains to be determined, recent studies suggest that adipose tissue and adipose stem cells (ASCs) influence breast cancer tumorigenesis and tumor progression.

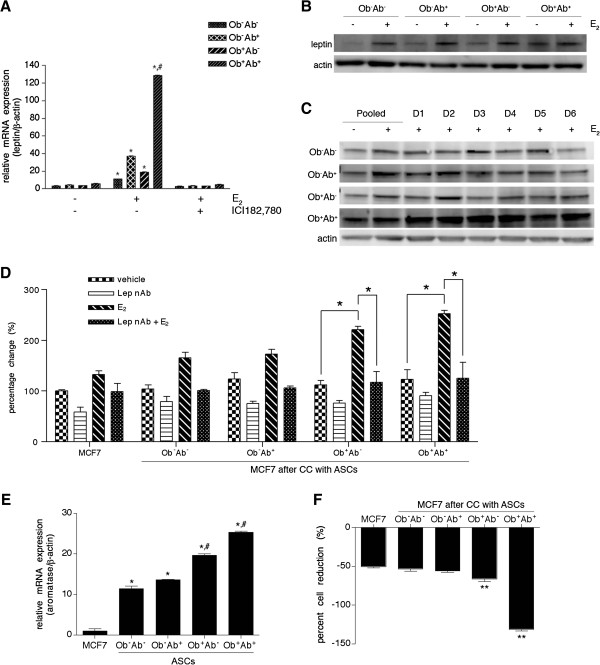
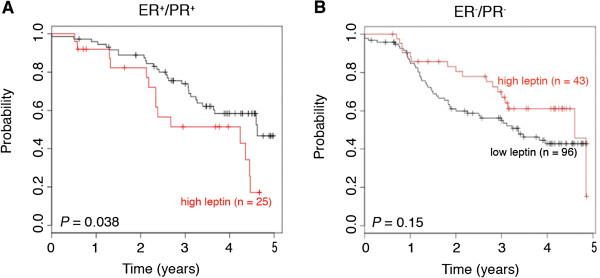
Methods: Breast cancer cells lines were co-cultured with ASCs (n = 24), categorized based on tissue site of origin and body mass index (BMI), and assessed for enhanced proliferation, alterations in gene expression profile with PCR arrays, and enhanced tumorigenesis in immunocompromised mice. The gene expression profile of ASCs was assess with PCR arrays and qRT-PCR and confirmed with Western blot analysis. Inhibitory studies were conducted by delivering estrogen antagonist ICI182,780, leptin neutralizing antibody, or aromatase inhibitor letrozole and assessing breast cancer cell proliferation. To assess the role of leptin in human breast cancers, Oncomine and Kaplan Meier plot analyses were conducted.

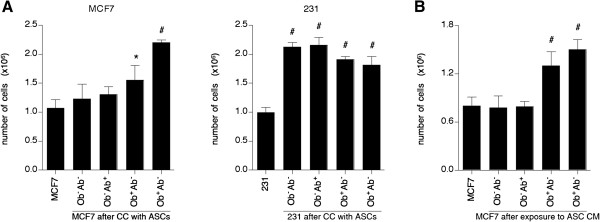
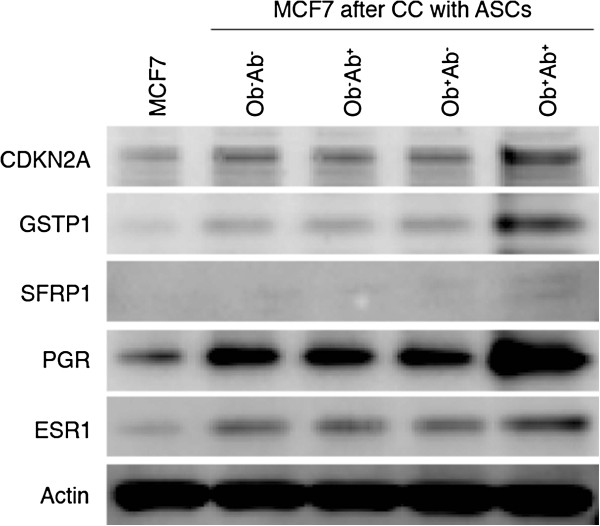
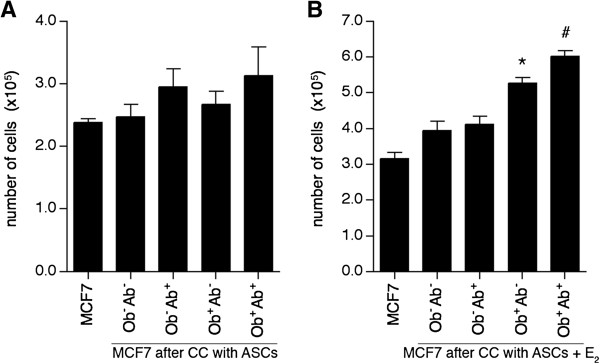
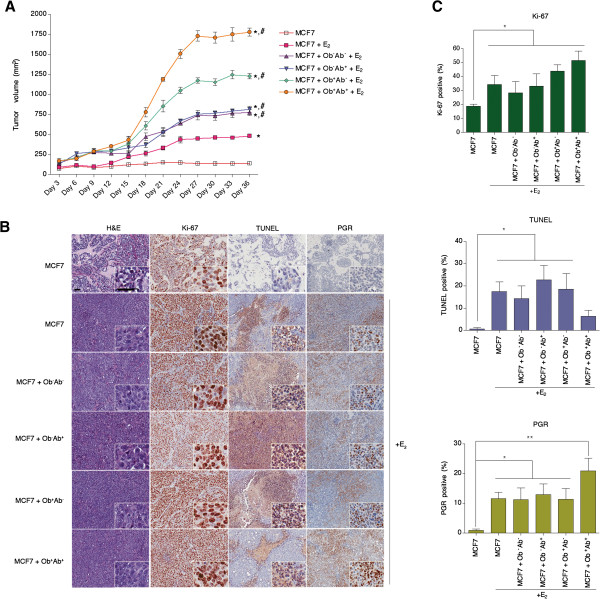
Results: ASCs derived from the abdominal subcutaneous adipose tissue of obese subjects (BMI > 30) enhanced breast cancer cell proliferation in vitro and tumorigenicity in vivo. These findings were correlated with changes in the gene expression profile of breast cancer cells after co-culturing with ASCs, particularly in estrogen receptor-alpha (ESR1) and progesterone receptor (PGR) expression. Analysis of the gene expression profile of the four groups of ASCs revealed obesity induced alterations in several key genes, including leptin (LEP). Blocking estrogen signaling with ICI182,780, leptin neutralizing antibody, or letrozole diminished the impact of ASCs derived from obese subjects. Women diagnosed with estrogen receptor/progesterone receptor positive (ER+/PR+) breast cancers that also expressed high levels of leptin had poorer prognosis than women with low leptin expression.

Conclusion: ASCs isolated from the abdomen of obese subjects demonstrated increased expression of leptin, through estrogen stimulation, which increased breast cancer cell proliferation. The results from this study demonstrate that abdominal obesity induces significant changes in the biological properties of ASCs and that these alterations enhance ER+/PR+ breast cancer tumorigenesis through estrogen dependent pathways.


Figures

Figure 1
Figure 1
Direct co-culture of breast cancer cells with ASCs result in increased proliferation in vitro. (A) After seven days of co-culture (CC) with six adipose stem cells (ASC) donors per group, quantification of MCF7 cells and MDA-MB-231 (231) cells was based on the percentage of GFP+ cells in the population multiplied by the total number of cells in each condition. (B) To determine the influence of ASCs on MCF7 cells indirectly, conditioned media (CM) from pooled ASCs (n = 6 donors per group) were collected and added to MCF7 cells. After seven days, the total number of MCF7 cells was counted. Values reported are the mean of three independent experiments, each performed in triplicate. Bars, ± SD. *, P <0.05; #, P <0.01.
Figure 2
Figure 2
Changes in the expression of cell cycle regulators and steroid receptors of MCF7 cells. MCF7 cells were grown alone or in the presence of ASCs (n = 6 donors per group) grouped by the donor’s obesity status and depot site of ASCs for seven days. Cell lysate from sorted GFP+ MCF7 cells was collected for Western blot analysis of CDKN2A, GSTP1, SFRP1, ESR1 and PGR. Blots were then stripped and probed for actin as a control.
Figure 3
Figure 3
Estrogen enhances the effect of ASCs on MCF7 proliferation in vitro. Adipose stem cells (ASCs) (n = 6 donors per group) were co-cultured (CC) with MCF7 cells in media supplemented with charcoal dextran stripped fetal bovine serum. (A) After seven days, quantification of MCF7 cells was based on the percentage GFP+ cells in the population multiplied by the total number of cells in the condition. (B) ASCs were grown in 10 nM estrogen (E2) replenished every three days, and after seven days, quantification of MCF7 cells was based on the percentage of GFP+ cells in the population multiplied by the total number of cells in each condition. Values reported are the mean of three independent experiments, each performed in triplicate. Bars, ± SD. *, P <0.05.
Figure 4
Figure 4
Donor’s obesity status and depot site of ASCs differentiates its influence on tumorigenicity in vivo. MCF7 cells alone (106) or MCF7 cells and adipose stem cells (ASCs) (n = 6 donors per group) were co-mixed in a 1:1 ratio (106 of each cell type) in a total volume of 50 μl of sterile PBS and mixed with 100 μl of reduced growth factor Matrigel™. Cells were injected into the fifth mammary fat pad of six-week old female ovariectomized SCID/beige mice (n = 5 mice per group). Estrogen was delivered subcutaneously in the neck as a 0.72 mg 60-day time-release estrogen pellet. Tumor volume was measured every 3 days for a total of 36 days. (A) Tumor volume of tumors formed with MCF7 cells alone or co-mixed cells (MCF7 and ASCs) injected into the mammary fat pad with or without estrogen pellet (E2). (B) Representative images of H&E, Ki-67, TUNEL and PGR staining of tumor sections from tumor sections taken at 10x and 40x. Scale bars both represent 50 μm. (C) Quantification of Ki-67, TUNEL and PGR staining with ImageScope represented as the percentage of positive pixels over total number of pixels per tumor section. Values reported are means of 10 tumor sections. Bars, ± SD. *, P <0.05 between MCF7 and other groups. #, P <0.01 between MCF7 with estrogen and other groups, **, P <0.001 between MCF7 and other groups.
Figure 5
Figure 5
Estrogen exposure influences leptin expression in ASCs. (A) Adipose stem cells ASCs (n = 6 donors per group) were cultured in media supplemented with charcoal dextran stripped FBS (CDS-FBS) supplemented with (E2) or ICI182,780. Cells were collected at 70% confluency and total RNA was isolated for real-time PCR analysis of leptin expression. (B) Cell lysate was collected from n = 6 ASC donors cultured in CDS-FBS with or without E2 at 70% confluency and subjected to Western blot analysis with 20 μg of protein and separated by SDS-page under reducing conditions, blotted and probed with antibodies to leptin or actin. (C) Cell lysate was collected from six different ASCs donors and either pooled or analyzed as individual donors (D#), cultured in CDS-FBS with or without estrogen. A total of 20 μg of protein was separated by SDS-page under reducing conditions, blotted, and probed with leptin and actin antibodies. (D) ASCs (n = 6 donors per group) were co-cultured with MCF7 cells and treated with vehicle (dimethyl sulfoxide, DMSO) neutralizing leptin antibody (Lep nAb), estrogen (E2) or neutralizing leptin antibody and estrogen (Lep nAb + E2) in complete culture media (CCM) containing CDS-FBS. After seven days, the number of MCF7 cells was calculated based on the percentage of GFP+ MCF7 cells by the total number of cells in the population. (E) ASCs (n = 6 donors per group) were cultured in CCM and collected at 70% confluency and total RNA was isolated for real-time PCR analysis of aromatase expression. (F) ASCs (n = 6 donors per group) were co-cultured with MCF7 cells and treated with letrozole (10 nM) in CCM. After seven days, the number of MCF7 cells was determined by the percentage of GFP+ cells multipled by the total number of cells. Percent change was determined by the relative change in the number of MCF7 cells after letrozole treatment compared to their non-treated controls. Values reported are the mean of three independent experiments, each performed in triplicate. Bars, ± SD. *, P <0.05; **, P <0.01; #, P <0.005.
Figure 6
Figure 6
Levels of leptin expression correlate with decreased survival in ER+/PR+ breast cancers. Kaplan Meier analysis of the probability of five-year relapse-free survival of women diagnosed with (A) ER+/PR+ or (B) ER-/PR- breast cancers based on leptin expression.

Similar articles

Cited by

References

    1. Cleary M, Maihle N. The role of body mass index in the relative risk of developing premenopausal versus postmenopausal breast cancer. Proc Soc Exp Biol Med. 1997;15:28–43. doi: 10.3181/00379727-216-44153B. - DOI - PubMed
    1. Calle EE, Rodriguez C, Walker-Thurmond K, Thun MJ. Overweight, obesity, and mortality from cancer in a prospectively studied cohort of U.S. adults. N Engl J Med. 2003;15:1625–1638. doi: 10.1056/NEJMoa021423. - DOI - PubMed
    1. Ahn J, Schatzkin A, Lacey JV Jr, Albanes D, Ballard-Barbash R, Adams KF, Kipnis V, Mouw T, Hollenbeck AR, Leitzmann MF. Adiposity, adult weight change, and postmenopausal breast cancer risk. Arch Intern Med. 2007;15:2091–2102. doi: 10.1001/archinte.167.19.2091. - DOI - PubMed
    1. Eliassen A, Colditz G, Rosner B, Willett W, Hankinson S. Adult weight change and risk of postmenopausal breast cancer. JAMA. 2006;15:193–201. doi: 10.1001/jama.296.2.193. - DOI - PubMed
    1. Sestak I, Distler W, Forbes J, Dowsett M, Howell A, Cuzick J. Effect of body mass index on recurrences in tamoxifen and anastrozole treated women: an exploratory analysis from the ATAC trial. J Clin Oncol. 2010;15:3411–3415. doi: 10.1200/JCO.2009.27.2021. - DOI - PubMed

MeSH terms