
Modeling precision treatment of breast cancer

Anneleen Daemen et al. Genome Biol. 2013.

Erratum in

  • Erratum to: Modeling precision treatment of breast cancer.
    Daemen A, Griffith OL, Heiser LM, Wang NJ, Enache OM, Sanborn Z, Pepin F, Durinck S, Korkola JE, Griffith M, Hur JS, Huh N, Chung J, Cope L, Fackler MJ, Umbricht C, Sukumar S, Seth P, Sukhatme VP, Jakkula LR, Lu Y, Mills GB, Cho RJ, Collisson EA, Van't Veer LJ, Spellman PT, Gray JW. Daemen A, et al. Genome Biol. 2015 May 12;16(1):95. doi: 10.1186/s13059-015-0658-5. Genome Biol. 2015. PMID: 25962591 Free PMC article.

Abstract

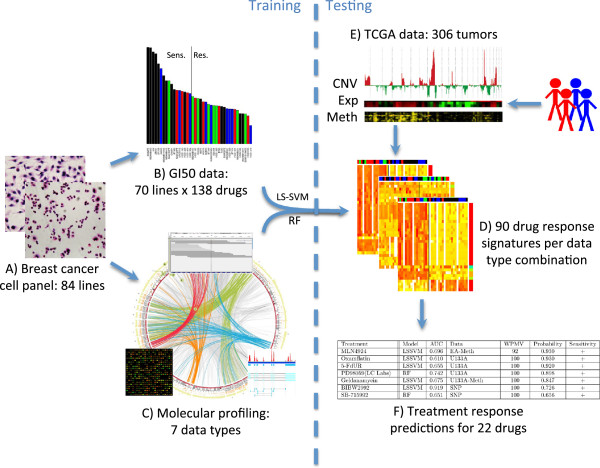
Background: First-generation molecular profiles for human breast cancers have enabled the identification of features that can predict therapeutic response; however, little is known about how the various data types can best be combined to yield optimal predictors. Collections of breast cancer cell lines mirror many aspects of breast cancer molecular pathobiology, and measurements of their omic and biological therapeutic responses are well-suited for development of strategies to identify the most predictive molecular feature sets.

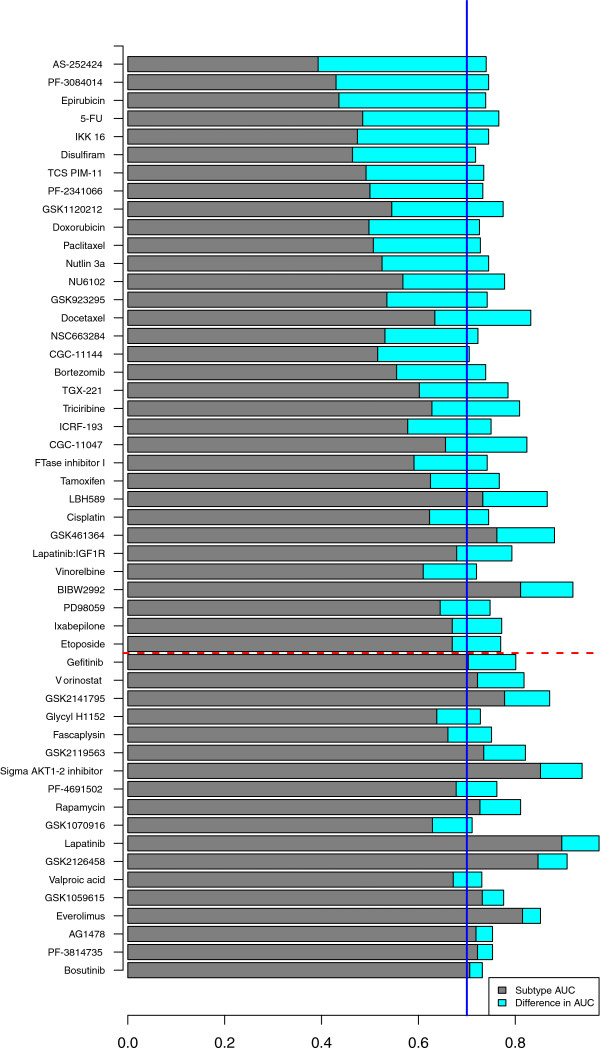
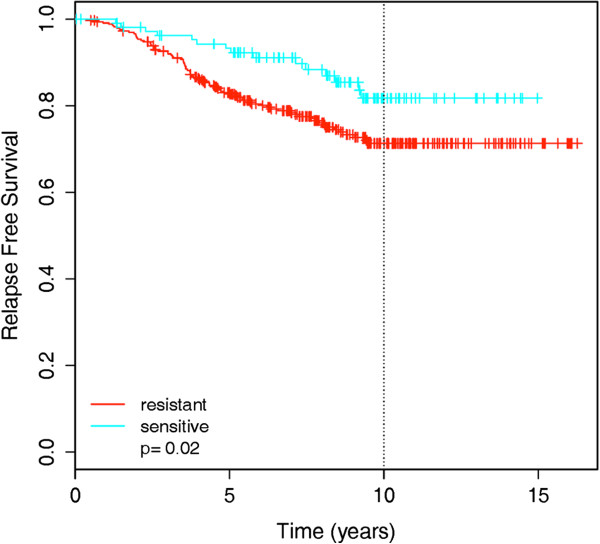
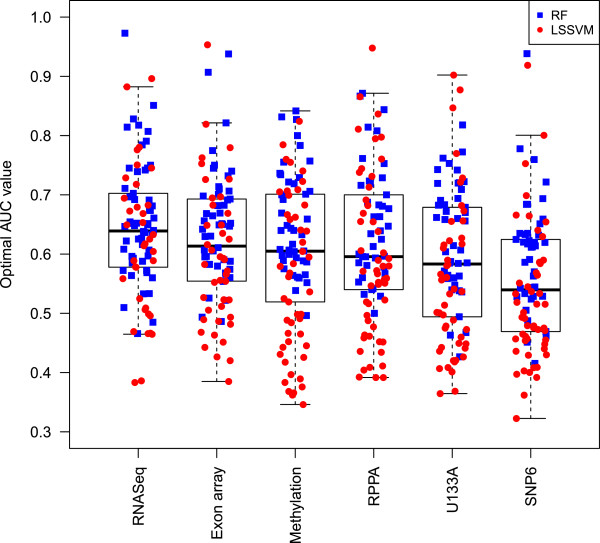
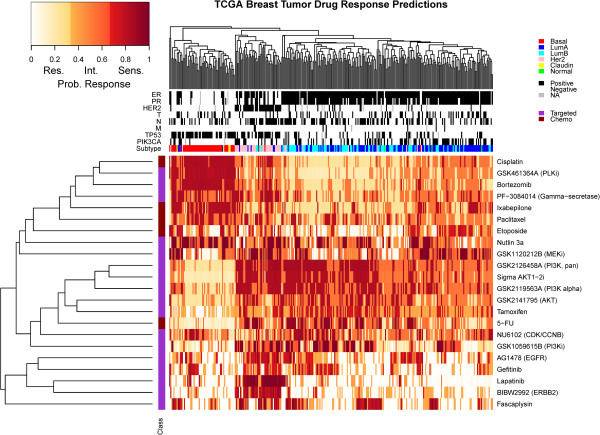
Results: We used least squares-support vector machines and random forest algorithms to identify molecular features associated with responses of a collection of 70 breast cancer cell lines to 90 experimental or approved therapeutic agents. The datasets analyzed included measurements of copy number aberrations, mutations, gene and isoform expression, promoter methylation and protein expression. Transcriptional subtype contributed strongly to response predictors for 25% of compounds, and adding other molecular data types improved prediction for 65%. No single molecular dataset consistently out-performed the others, suggesting that therapeutic response is mediated at multiple levels in the genome. Response predictors were developed and applied to TCGA data, and were found to be present in subsets of those patient samples.

Conclusions: These results suggest that matching patients to treatments based on transcriptional subtype will improve response rates, and inclusion of additional features from other profiling data types may provide additional benefit. Further, we suggest a systems biology strategy for guiding clinical trials so that patient cohorts most likely to respond to new therapies may be more efficiently identified.


Figures

Figure 1
Figure 1
Cell line-based response prediction strategy. (A) We assembled a collection of 84 breast cancer cell lines composed of 35 luminal, 27 basal, 10 claudin-low, 7 normal-like, 2 matched normal and 3 of unknown subtype. Fourteen luminal and 7 basal cell lines were also ERBB2-amplified. (B) Seventy lines were tested for response to 138 compounds by growth inhibition assays. Compounds with low variation in response in the cell line panel were eliminated, leaving a response data set of 90 compounds. Cell lines were divided into a sensitive and resistant group for each compound using the mean GI50 value for that compound. (C) Seven pretreatment molecular profiling data sets were analyzed to identify molecular features associated with response. Exome-seq data were available for 75 cell lines, followed by SNP6 data for 74 cell lines, RNAseq for 56, exon array for 56, RPPA for 49, methylation for 47, and U133A expression array data for 46 cell lines. All 70 lines were used in development of at least some predictors depending on data type availability. (D) Classification signatures were developed using the molecular feature data (after filtering) and with response status as the target. Two methods, weighted least squares support vector machine (LS-SVM) and random forests (RF), were utilized. The best performing signature was chosen for each drug and data type combination. This allows prediction of response for additional cell lines or tumors with any given combination of input data types. (E) Cell line-based response predictors were applied to 306 TCGA breast tumors for which expression (Exp), copy number (CNV) and methylation (Meth) measurements were all available. (F) This identified 22 compounds with a model AUC >0.7 for which at least some patients were predicted to be responsive with a probability >0.65. Thresholds for considering a tumor responsive were objectively chosen for each compound from the distribution of predicted probabilities and each patient was assigned to a status of resistant, intermediate or sensitive. WPMV, weighted percent of model variables.
Figure 2
Figure 2
Comparison of transcriptional subtype and molecular profiling for 51 (57%) of the compounds with predicted compound response within the cell lines with high estimated accuracy (AUC >0.70). AUC obtained with transcriptional subtype is shown in gray. Compounds are ordered based on increase in AUC from subtype to the best performing molecular data. The increase in AUC with respect to subtype obtained with the best performing molecular data is shown in cyan. For 65% of the compounds, molecular profiling performed substantially better than subtype, with an AUC increase of at least 0.1 (compounds above the red dashed line). Subtype was sufficient for 25% of the compounds with AUC >0.70 and AUC increase obtained with molecular profiling less than 0.1 (compounds below the red dashed line with subtype AUC above the blue solid line).
Figure 3
Figure 3
Validation of the cell line signature for tamoxifen in a meta-set of 439 breast cancer patients treated with tamoxifen. Kaplan-Meier plot of relapse free survival for patients predicted to be sensitive versus resistant to tamoxifen according to the 174-gene cell line-based predictor.
Figure 4
Figure 4
Boxplot of best AUC values for all 90 compounds across 6 data types. For all data types, the highest AUC obtained with either approach (LS-SVM in red circles, or random forest in blue squares) is displayed. For RNAseq and exon array, the highest AUC is shown among models built on gene-level data only versus all features (exons, junctions, and so on). The one-way repeated measures ANOVA test revealed a significant difference in performance among any of the data types (P-value 2.6e-5). Post hoc pairwise comparisons with multiple testing correction revealed a significant outperformance of RNAseq with respect to all other data types. SNP6 copy number performed significantly worse compared to all other data types, and exon array additionally significantly outperformed U133A.
Figure 5
Figure 5
Heatmap representation of predicted sensitivity in the TCGA population. This heatmap represents the predicted pattern of sensitivity in 306 TCGA patients with expression, methylation and copy number data for 22 compounds with model AUC >0.7 and with at least some patients predicted to respond with probability >0.65. For the 306 patients, association is shown with ER, progesterone receptor (PR), ERBB2 status, tumor size (T), lymph node involvement (N), distant metastasis (M), and subtype. Of the 22 therapeutic compounds, 5 are chemotherapeutic and 17 are targeted agents. Probability values shown were re-scaled to reflect custom sensitivity thresholds as described in Supplementary Methods of Additional file 3. Res., resistant; Int., intermediate; Sens., sensitive.

References

    1. Parker JS, Mullins M, Cheang MC, Leung S, Voduc D, Vickery T, Davies S, Fauron C, He X, Hu Z, Quackenbush JF, Stijleman IJ, Palazzo J, Marron JS, Nobel AB, Mardis E, Nielsen TO, Ellis MJ, Perou CM, Bernard PS. Supervised risk predictor of breast cancer based on intrinsic subtypes. J Clin Oncol. 2009;14:1160–1167. doi: 10.1200/JCO.2008.18.1370. - DOI - PMC - PubMed
    1. Reis-Filho JS, Pusztai L. Gene expression profiling in breast cancer: classification, prognostication, and prediction. Lancet. 2011;14:1812–1823. doi: 10.1016/S0140-6736(11)61539-0. - DOI - PubMed
    1. Curtis C, Shah SP, Chin SF, Turashvili G, Rueda OM, Dunning MJ, Speed D, Lynch AG, Samarajiwa S, Yuan Y, Gräf S, Ha G, Haffari G, Bashashati A, Russell R, McKinney S, Langerød A, Green A, Provenzano E, Wishart G, Pinder S, Watson P, Markowetz F, Murphy L, Ellis I, Purushotham A, Børresen-Dale AL, Brenton JD, Tavaré S. METABRIC Group et al.The genomic and transcriptomic architecture of 2,000 breast tumours reveals novel subgroups. Nature. 2012;14:346–352. - PMC - PubMed
    1. The Cancer Genome Atlas Network. Comprehensive characterization of the molecular portraits of human breast tumors. Nature. 2012;14:61–67. doi: 10.1038/nature11412. - DOI - PMC - PubMed
    1. Holm K, Hegardt C, Staaf J, Vallon-Christersson J, Jonsson G, Olsson H, Borg A, Ringner M. Molecular subtypes of breast cancer are associated with characteristic DNA methylation patterns. Breast Cancer Res. 2010;14:R36. doi: 10.1186/bcr2590. - DOI - PMC - PubMed

Publication types

MeSH terms

Substances