. 2013;14(10):R121.
doi: 10.1186/gb-2013-14-10-r121.

Genome-wide incorporation dynamics reveal distinct categories of turnover for the histone variant H3.3

Genome-wide incorporation dynamics reveal distinct categories of turnover for the histone variant H3.3

Daniel C Kraushaar et al. Genome Biol. 2013.

Erratum in

Abstract

Background: Nucleosomes are present throughout the genome and must be dynamically regulated to accommodate binding of transcription factors and RNA polymerase machineries by various mechanisms. Despite the development of protocols and techniques that have enabled us to map nucleosome occupancy genome-wide, the dynamic properties of nucleosomes remain poorly understood, particularly in mammalian cells. The histone variant H3.3 is incorporated into chromatin independently of DNA replication and requires displacement of existing nucleosomes for its deposition. Here, we measure H3.3 turnover at high resolution in the mammalian genome in order to present a genome-wide characterization of replication-independent H3.3-nucleosome dynamics.

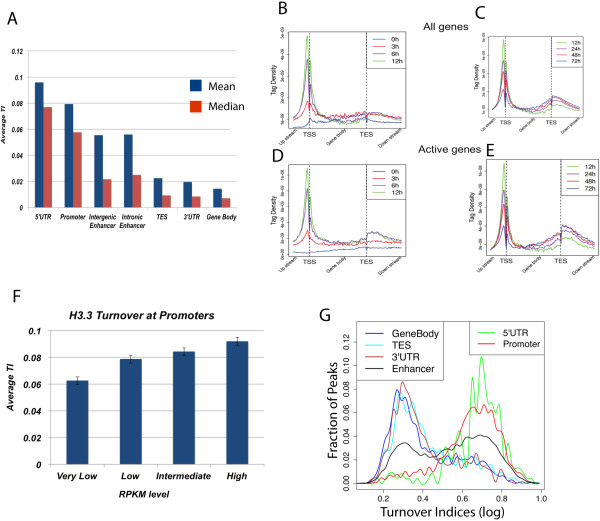
Results: We developed a system to study the DNA replication-independent turnover of nucleosomes containing the histone variant H3.3 in mammalian cells. By measuring the genome-wide incorporation of H3.3 at different time points following epitope-tagged H3.3 expression, we find three categories of H3.3-nucleosome turnover in vivo: rapid turnover, intermediate turnover and, specifically at telomeres, slow turnover. Our data indicate that H3.3-containing nucleosomes at enhancers and promoters undergo rapid turnover that is associated with active histone modification marks including H3K4me1, H3K4me3, H3K9ac, H3K27ac and the histone variant H2A.Z. The rate of turnover is negatively correlated with H3K27me3 at regulatory regions and with H3K36me3 at gene bodies.

Conclusions: We have established a reliable approach to measure turnover rates of H3.3-containing nucleosomes on a genome-wide level in mammalian cells. Our results suggest that distinct mechanisms control the dynamics of H3.3 incorporation at functionally different genomic regions.


Figures

Figure 1
Figure 1
A versatile system to study replication-independent nucleosome dynamics in mammals. (A) Schematic of TET-inducible expression system to study H3.3 turnover. CMV, cytomegalovirus; rtTA, reverse tetracycline-controlled transactivator; TRE, tetracycline responsive elements. (B) Western blot showing protein levels of transgenic HA/FLAG-H3.3 compared to endogenous H3.3. HA/FLAG-H3.3 expression 24 hours after DOX addition. The band marked with an asterisk is non-specific. The arrow marks transgenic HA/FLAG-H3.3. (C) Time course western blots of HA/FLAG-H3.3 expression. (D) Bromodeoxyuridine (BrdU) immunostaining of NIH/3 T3 cells treated with DNA polymerase inhibitor aphidicolin and DOX across time points of H3.3 induction. DMSO, dimethylsulfoxide. (E) Cell cycle analysis of cells treated with aphidicolin/DOX. Cells were stained with propidium iodide and analyzed by flow cytometry.
Figure 2
Figure 2
Distribution and enrichment of H3.3 in the genome. (A) Enrichment of HA-H3.3 at various genomic regions of different annotation. The total read count of each category was normalized over its total length. (B) Pie chart showing the proportions and numbers of peak centers that fall into various genomic categories. (C) Enrichment of HA-H3.3 at various repetitive elements. All_Rep, all repetitive elements; SAT, satellite regions; SINE, short interspersed nuclear element. (D) Count of histone mark peaks that overlap with HA-H3.3 peaks. Overlapped peaks were defined as overlapping when one peak (H3.3 or histone mark) shared 10% of reads with the other. ChIP-Seq libraries for various histone marks were prepared from cells treated with aphidicolin. (E) UCSC Genome browser view illustrating overlap of HA-H3.3 with various histone marks and H2AZ. (F) Distribution profile of HA-H3.3 based on mRNA expression levels as indicated by different colors. RNA-seq libraries were prepared from cells treated with aphidicolin. (G) Distribution profile of HA-H3.1 based on mRNA expression levels as indicated by different colors. ChIP-Seq and RNA-Seq libraries were prepared from untreated (no aphidicolin) cells.
Figure 3
Figure 3
H3.3 nucleosomes display fast and slow turnover rates. (A) Genome browser view of HA-H3.3 profiles at several genomic regions over a 6-hour time frame. Examples of HA-H3.3 peaks that exhibit slow (left two panels), intermediate (center two panels) and fast turnover (right two panels) are displayed. (B) Dot plot of turnover indices calculated from two independent experiments. (C) Heat map showing relative HA-H3.3 enrichment (red = low, green = high) across all time points sorted by turnover index from low to high. (D) Distribution of turnover indices reveals two populations of H3.3 nucleosome exchange.
Figure 4
Figure 4
Promoters and enhancers are associated with fast H3.3 nucleosome turnover whereas gene body and transcription end site regions are associated with slow H3.3 nucleosome turnover. (A) Median and mean turnover indices (TIs) calculated for various genomic regions. Intergenic enhancers were defined as peaks that are located in intergenic regions at least 1 kb from the TSS. Intronic enhancers were defined as peaks located in introns only. Gene body regions were defined as broad peaks that spanned both intronic and exonic regions and shared significant overlap with H3K36me3. (B-E) Distribution profiles of HA-H3.3 from TSS to TES at different time points. (F) Distribution plot illustrating the range of turnover indices within various genomic categories. Turnover rates were log-normalized. RPKM, reads per kilobase of exon model per million reads. (G) Distribution plot illustrating the range of turnover indices of H3.3 nucleosomes within various genomic categories. Log of turnover indices was calculated and re-scaled from 0 to 1.
Figure 5
Figure 5
Fast turnover rates are associated with active histone modifications. (A) Heat map illustrating the relation between turnover rates and histone marks. Turnover indices were sorted from low to high (top to bottom). Relative enrichment (red = low, green = high) levels of various histone marks is shown. (B) Enrichment values for various histone marks were grouped into four bins with increasing enrichment levels and mean turnover indices were calculated for each bin. (C) Missing any of the five ‘active’ modifications decreases the H3.3 turnover index of enhancer nucleosomes. The turnover indices for enhancer H3.3 nucleosomes containing all five active modifications or missing one single modification are indicated on the y-axis. (D) Association with any of the five active modifications increases the turnover index of H3.3-nucleosomes at enhancers. The turnover indices for enhancer H3.3 nucleosomes containing none of the five active modifications or only one modification are indicated on the y-axis. (E) Association with either H3K27me3 or H3K36me3 decreases the turnover index of H3.3 nucleosomes. The turnover indices are indicated on the y-axis for H3.3 nucleosomes containing all five active modifications (only active) or five active modifications plus either H3K27me3 or H3K36me3 or both.
Figure 6
Figure 6
Different repetitive sequences display distinct H3.3 turnover rates. (A-C) Mapping of HA-H3.3 to repetitive elements across all time points showing turnover of H3.3 at tRNA (A), rRNA (B) and telomeric repeats (C).

References

    1. Jin C, Zang C, Wei G, Cui K, Peng W, Zhao K, Felsenfeld G. H3.3/H2A.Z double variant-containing nucleosomes mark 'nucleosome-free regions' of active promoters and other regulatory regions. Nat Genet. 2009;14:941–945. doi: 10.1038/ng.409. - DOI - PMC - PubMed
    1. Jin C, Felsenfeld G. Nucleosome stability mediated by histone variants H3.3 and H2A.Z. Genes Dev. 2007;14:1519–1529. doi: 10.1101/gad.1547707. - DOI - PMC - PubMed
    1. Ng RK, Gurdon JB. Epigenetic memory of an active gene state depends on histone H3.3 incorporation into chromatin in the absence of transcription. Nat Cell Biol. 2008;14:102–109. doi: 10.1038/ncb1674. - DOI - PubMed
    1. Hu G, Cui K, Northrup D, Liu C, Wang C, Tang Q, Ge K, Levens D, Crane-Robinson C, Zhao K. H2A.Z facilitates access of active and repressive complexes to chromatin in embryonic stem cell self-renewal and differentiation. Cell Stem Cell. 2013;14:180–192. doi: 10.1016/j.stem.2012.11.003. - DOI - PMC - PubMed
    1. Henikoff S, Furuyama T, Ahmad K. Histone variants, nucleosome assembly and epigenetic inheritance. Trends Genet. 2004;14:320–326. doi: 10.1016/j.tig.2004.05.004. - DOI - PubMed

Publication types

Associated data