. 2013 Nov 1;14(11):R122.
doi: 10.1186/gb-2013-14-11-r122.

Analysis of expressed SNPs identifies variable extents of expression from the human inactive X chromosome

Analysis of expressed SNPs identifies variable extents of expression from the human inactive X chromosome

Allison M Cotton et al. Genome Biol. .

Abstract

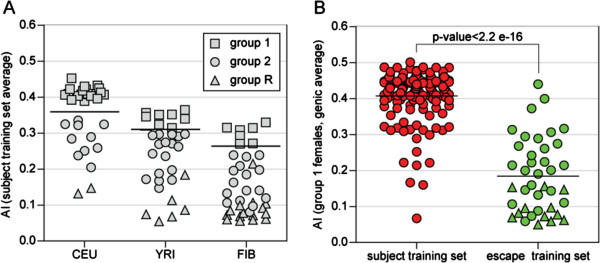
Background: X-chromosome inactivation (XCI) results in the silencing of most genes on one X chromosome, yielding mono-allelic expression in individual cells. However, random XCI results in expression of both alleles in most females. Allelic imbalances have been used genome-wide to detect mono-allelically expressed genes. Analysis of X-linked allelic imbalance in females with skewed XCI offers the opportunity to identify genes that escape XCI with bi-allelic expression in contrast to those with mono-allelic expression and which are therefore subject to XCI.

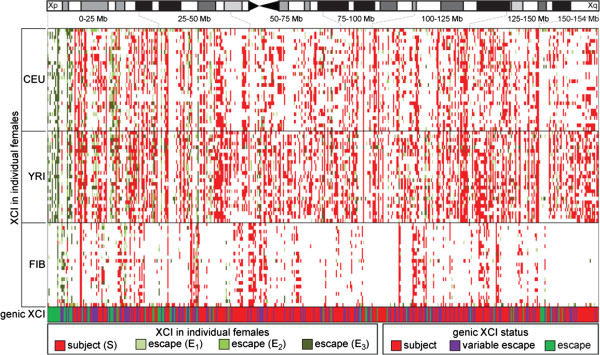
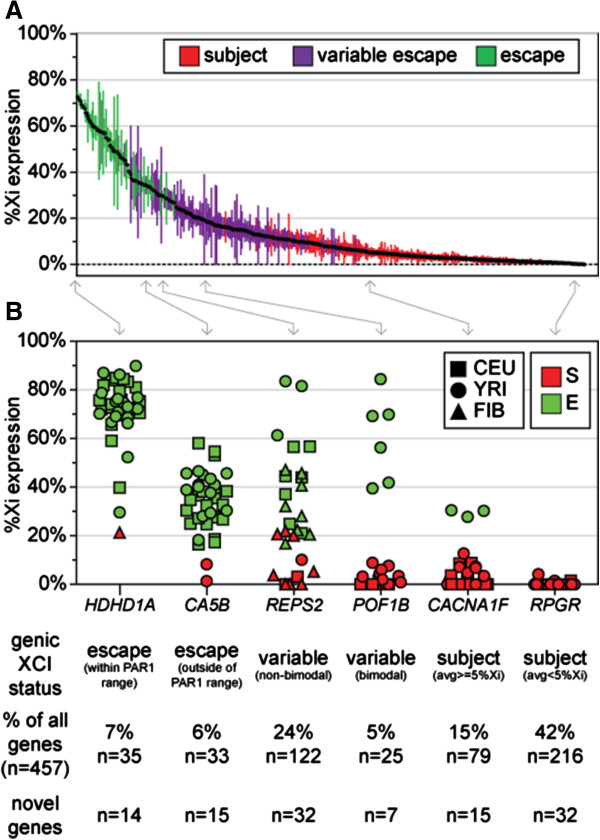
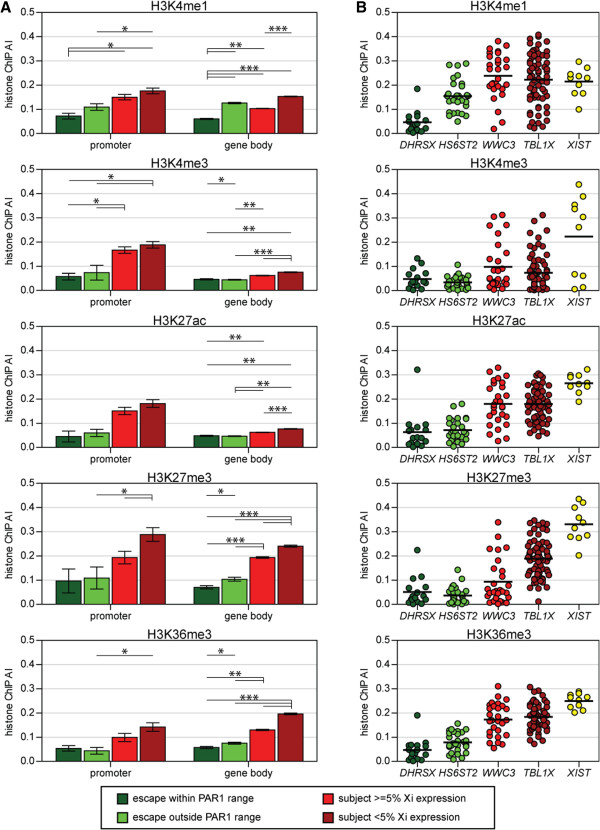
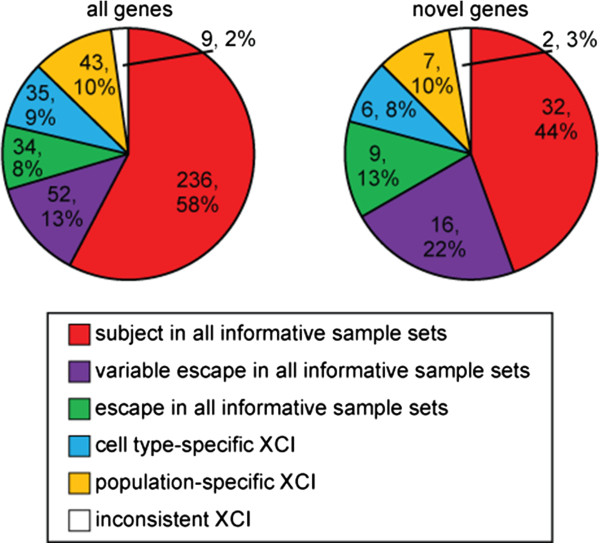
Results: We determine XCI status for 409 genes, all of which have at least five informative females in our dataset. The majority of genes are subject to XCI and genes that escape from XCI show a continuum of expression from the inactive X. Inactive X expression corresponds to differences in the level of histone modification detected by allelic imbalance after chromatin immunoprecipitation. Differences in XCI between populations and between cell lines derived from different tissues are observed.

Conclusions: We demonstrate that allelic imbalance can be used to determine an inactivation status for X-linked genes, even without completely non-random XCI. There is a range of expression from the inactive X. Genes escaping XCI, including those that do so in only a subset of females, cluster together, demonstrating that XCI and location on the X chromosome are related. In addition to revealing mechanisms involved in cis-gene regulation, determining which genes escape XCI can expand our understanding of the contributions of X-linked genes to sexual dimorphism.


Figures

Figure 1
Figure 1
Genes that escape XCI have significantly lower AIs than genes that are subject to XCI. (A) The degree of skewing of XCI varies between sample sets. To determine the degree of skewing all genes from the subject training set were examined (minimum of two probes per gene) and the average AI per gene determined (only probes with a total cDNA greater than the sample set threshold; Additional file 2). The thick black line shows the AI at which 99.5% of autosomal genes are found. Females with an average AI from the subject training set above this threshold were classified as the most highly skewed females in each population (group 1, squares), females below this threshold were classified as either group 2 (circles) or group R (triangles). (B) Examining group 1 females only, genes from the escape training set (green) have a significantly (P-value <2.2 e-16) lower genic AI than genes from the subject training set (red). Genes located in the Xp pseudoautosomal region (PAR1) are shown as triangles while circles represent non-PAR1 genes.
Figure 2
Figure 2
The majority of genes are subject to XCI. XCI status in individual informative females with each column representing one gene (only genes with at least one informative female are included) and each row a single female (group 1 and group 2 females only) from the three sample sets. The XCI status of each female is either subject to XCI (red) or escapes from XCI (E3, light green; E2, bright green; E1, dark green). For how AIs were converted into XCI status, see Additional files 2, 5, 9 and 12. The genic XCI status was determined by calculating the percentage of females that escaped from XCI for each gene. Subject to XCI (red: 0 to 22% of informative females escaped from XCI), variable escape from XCI (purple: 22 to 78% of informative females escaped from XCI) and escape from XCI (green: 78 to 100% of informative females escaped from XCI). An ideogram of the X chromosome is shown with 25 Mb regions shown with grey dotted lines.
Figure 3
Figure 3
Distribution of average %Xi expression levels shows a range of expression. (A) Ranked average %Xi expression (highest to left, lowest to right). Error bars represent the standard error of the mean while the color indicates the assigned genic XCI status. (B) For each gene, informative females are represented with a different shape based on the sample set (CEU, square; YRI, circle; FIB, triangle) and color based on XCI status (E, green; S, red). Note that the E and S ranges overlap because the E:S boundary differs in each female based on skewing. The genic XCI status was determined by calculating the percentage of females that escaped from XCI for each gene: subject (red), 0 to 22% of informative females escaped from XCI; variable escape (purple), 22 to 78% of informative females escaped from XCI: escape (green), 78 to 100% of informative females escaped from XCI. The number and percentage of all genes is given below each example as well as the number of novel calls in each category. The number of informative females for each example gene is: HDHD1A n = 39, CA5B n = 36, REPS2 n = 30, POF1B n = 22, CACNA1F n = 32 and RPGR n = 41.
Figure 4
Figure 4
Histone ChIP AI of individual histone modifications is generally highest at genes subject to XCI. (A) Each histone modification is shown in a separate panel (H3K4me1, H3K4me3, H3K27ac, H3K27me3 and H3K36me3). Error bars represent the standard error of the mean while the color indicates the assigned genic XCI status: genes that escape XCI and have a %Xi expression within the PAR1 range (dark green), genes that escape XCI and have a %Xi expression outside the PAR1 range (green), genes that are subject to XCI and have a %Xi expression greater than 5%Xi (red) and genes that are subject to XCI and have a %Xi expression less than 5%Xi (dark red). (B) Examples of gene body histone ChIP AI of individual gene loci from each %Xi expression level along with XIST. Significant differences between means are shown as asterisks (*P-value 0.05 to 1.0 e-5, **P-value 1.0 e-5 to 1.0 e-15, ***P-value <1.0 e-15). All P-values were corrected for multiple comparisons.
Figure 5
Figure 5
The majority of genes show the same XCI status in all informative sample sets. X-linked genes are mostly subject to XCI (red), show variable escape (purple) or escape from XCI (green) in all sample sets. Three classes of genes show a different XCI status in at least one informative sample set: population-specific XCI (orange), cell line-specific XCI (blue) and inconsistent XCI across the informative sample sets (white). At least five females were required to be informative in each informative sample set for a gene to be considered as differing between sample sets. Novel genes are included within the 'all genes’. The decision tree used to classify genes is shown in Additional file 13.

References

    1. Ge B, Pokholok DK, Kwan T, Grundberg E, Morcos L, Verlaan DJ, Le J, Koka V, Lam KC, Gagné V, Dias J, Hoberman R, Montpetit A, Joly MM, Harvey EJ, Sinnett D, Beaulieu P, Hamon R, Graziani A, Dewar K, Harmsen E, Majewski J, Göring HH, Naumova AK, Blanchette M, Gunderson KL, Pastinen T. Global patterns of cis variation in human cells revealed by high-density allelic expression analysis. Nat Genet. 2009;14:1216–1222. doi: 10.1038/ng.473. - DOI - PubMed
    1. Morcos L, Ge B, Koka V, Lam KC, Pokholok DK, Gunderson KL, Montpetit A, Verlaan DJ, Pastinen T. Genome-wide assessment of imprinted expression in human cells. Genome Biol. 2011;14:R25. doi: 10.1186/gb-2011-12-3-r25. - DOI - PMC - PubMed
    1. Pastinen T. Genome-wide allele-specific analysis: insights into regulatory variation. Nat Rev Genet. 2010;14:533–538. - PubMed
    1. Minks J, Robinson WP, Brown CJ. A skewed view of X chromosome inactivation. J Clin Invest. 2008;14:20–23. doi: 10.1172/JCI34470. - DOI - PMC - PubMed
    1. Plagnol V, Uz E, Wallace C, Stevens H, Clayton D, Ozcelik T, Todd JA. Extreme clonality in lymphoblastoid cell lines with implications for allele specific expression analyses. PLoS ONE. 2008;14:e2966. doi: 10.1371/journal.pone.0002966. - DOI - PMC - PubMed

Publication types