. 2013 Dec;54(6):404-15.
doi: 10.1016/j.ceca.2013.09.003. Epub 2013 Oct 16.

TRPM7 triggers Ca2+ sparks and invadosome formation in neuroblastoma cells

Affiliations

TRPM7 triggers Ca2+ sparks and invadosome formation in neuroblastoma cells

Daan Visser et al. Cell Calcium. 2013 Dec.

Abstract

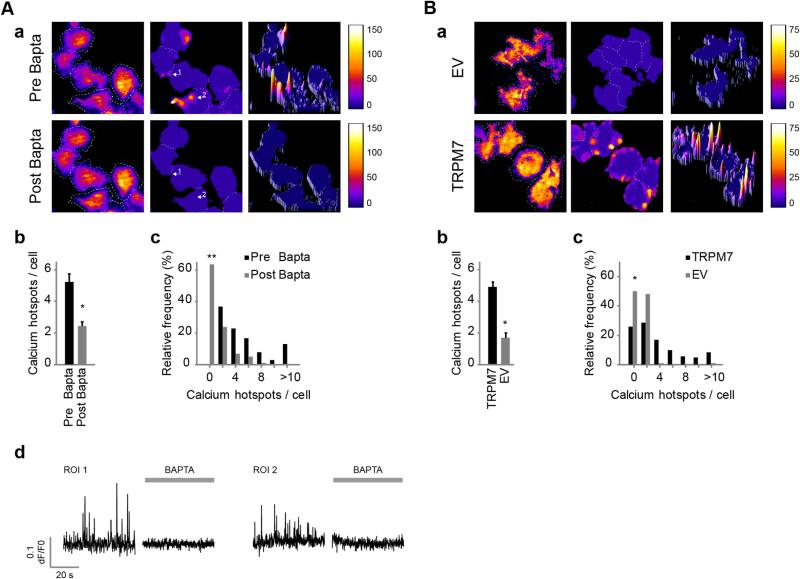
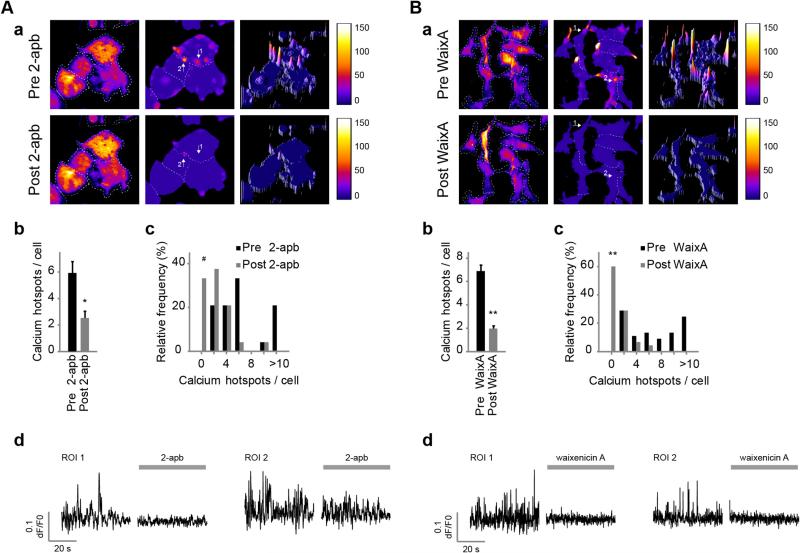
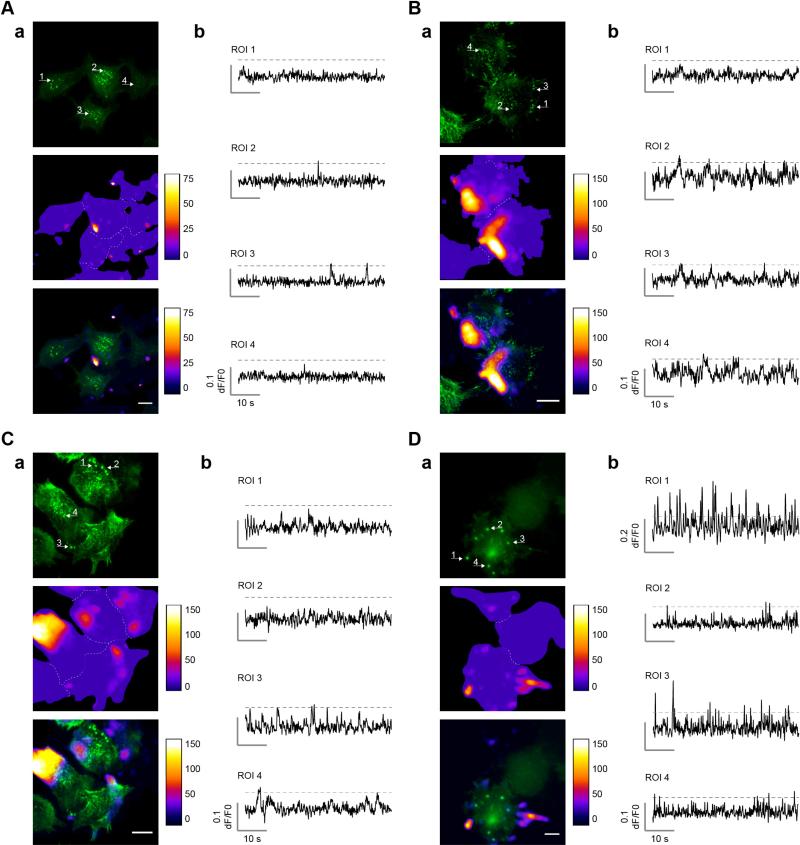
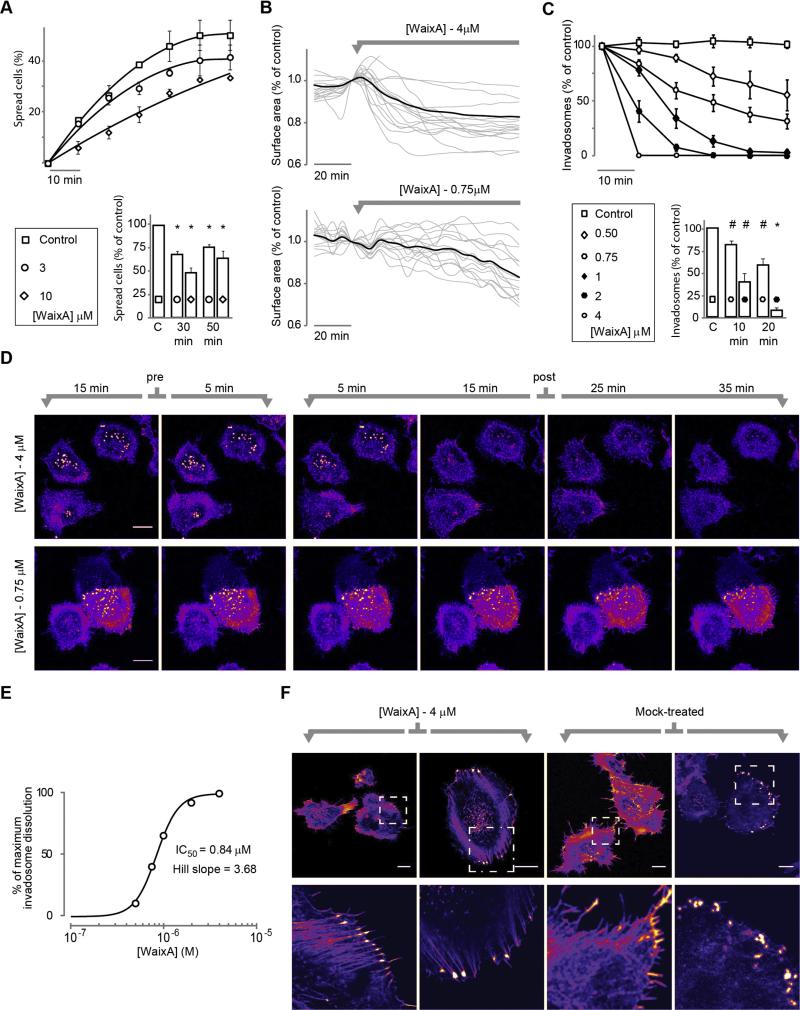
Cell migration depends on the dynamic formation and turnover of cell adhesions and is tightly controlled by actomyosin contractility and local Ca2+ signals. The divalent cation channel TRPM7 (Transient Receptor Potential cation channel, subfamily Melastatin, member 7) has recently received much attention as a regulator of cell adhesion, migration and (localized) Ca2+ signaling. Overexpression and knockdown of TRPM7 affects actomyosin contractility and the formation of cell adhesions such as invadosomes and focal adhesions, but the role of TRPM7-mediated Ca2+ signals herein is currently not understood. Using Total Internal Reflection Fluorescence (TIRF) Ca2+ fluorometry and a novel automated analysis routine we have addressed the role of Ca2+ in the control of invadosome dynamics in N1E-115 mouse neuroblastoma cells. We find that TRPM7 promotes the formation of highly repetitive and localized Ca2+ microdomains or "Ca2+ sparking hotspots" at the ventral plasma membrane. Ca2+ sparking appears strictly dependent on extracellular Ca2+ and is abolished by TRPM7 channel inhibitors such as waixenicin-A. TRPM7 inhibition also induces invadosome dissolution. However, invadosome formation is (functionally and spatially) dissociated from TRPM7-mediated Ca2+ sparks. Rather, our data indicate that TRPM7 affects actomyosin contractility and invadosome formation independent of Ca2+ influx.

Keywords: 2-APB; 2-aminoethyl diphenylborinate; Adhesion; BK; Ca(2+) imaging; Ca(2+) signaling; ECM; FA; FC; Invadosome; TIRF; TIRF microscopy; TRPM7; Total Internal Reflection Fluorescence (microscopy); Transient Receptor Potential cation channel, subfamily Melastatin, member 7; bradykinin; extracellular matrix; focal adhesion; focal complex.


Figures

Fig. 1
Fig. 1
EDTA-AM pretreatment unveils Ca2+ sparks in N1E-115/TRPM7 cells. (A) N1E-115/TRPM7 cells loaded with Oregon Green 488 BAPTA-1-AM and EDTA-AM were imaged for 100 s at 10 Hz frame rate by TIRF microscopy. (a) Left column: three examples of unprocessed images; middle column, images corrected by subtraction of a static background (i.e. the minimum intensity of the entire time-series); right column, images processed by the running background correction as detailed in the text. Note the normalization of cellular fluorescence signal and the much improved visualization of Ca2+ sparks in this column. (b) Intensity profiles taken along the dashed lines in each of the panels in a. Note that the uneven fluorescence present in the unprocessed images is effectively normalized by the running background correction (open arrows) enabling clear detection of Ca2+ sparks (closed arrows). (B) Representative Ca2+ traces for two ROIs (see C) with Ca2+ spark activity and two corresponding background (*) ROIs. Left column: in unprocessed traces Ca2+ sparks appear on a noisy background that shows local slow fluctuations (compare e.g. ROI-1 and ROI-2). High-amplitude Ca2+ sparks in ROI-1 can be easily thresholded but low-amplitude signals in ROI-2 are buried in background. The running background correction (column 3) but not the static correction (column 2) eliminates the fluctuations sufficiently to allow discrimination of low-amplitude signals (ROI-2) by setting a single detection threshold (gray dashed lines in the Ca2+ traces). Right column: zoom-in of the data in the gray boxes in the third column, showing detected Ca2+ sparks (*). (C) Left: input image; middle: 2-D heatmap of Ca2+ hotspots; right: 3-D representation of the heatmap emphasizing existence of hotspots of spark activity. Pseudocolors depict the number of frames in which [Ca2+]i exceeded the detection threshold. Note that Ca2+ hotspots are predominantly found at the cell periphery. Dashes indicate cell outlines. Scale bar = 20 μm.
Fig. 2
Fig. 2
Ca2+ sparking requires Ca2+ influx and correlates with TRPM7 expression levels. (A) N1E-115/TRPM7 cells loaded with Oregon Green 488 BAPTA-1-AM and EDTA-AM were imaged before and after the application of BAPTA. (a) Left: input image; middle and right, 2-D and 3-D heatmaps, respectively. Representative heatmaps of Ca2+ spark formation over time before (top) and after (bottom) application of BAPTA are depicted. For interpretation of heatmaps, see the legend of Fig. 1C and the text. (b) Average number of Ca2+ hotspots per cell before and after application of BAPTA (n = 101 [pre] and n = 37 [post], p < 0.001 versus pre; Mann–Whitney U-test, two-tailed). (c) Frequency histogram (n = 101, p0.001 versus pre, McNemar's test for paired proportions, two-tailed). (d) Ca2+ spark traces of representative Ca2+ hotspots (arrows in a) before (left) and after (right) BAPTA treatment. (B) N1E-115/TRPM7 cells were compared to their empty-vector controls with 3-fold lower TRPM7 expression. (a) Representative heatmaps of Ca2+ spark activity. (b) Mean number of Ca2+ hotspots per cell that showed Ca2+ sparking (n = 58 [N1E-115/EV] and n = 202 [N1E-115/TRPM7], p < 0.001; Mann–Whitney U-test, two-tailed). (c) Frequency distribution of sparking activity (n = 116 [N1E-115/EV], and n = 272 [N1E-115/TRPM7], p < 0.001; Fisher's exact test, two-tailed). Data in this figure represent mean ± SEM of at least 5 independent experiments. *p < 0.001 and **p < 0.0001.
Fig. 3
Fig. 3
Ca2+ sparks are mediated by TRPM7. Application of (A) 2-APB (100 μM) and (B) waixenicin-A (3–10 μM) inhibit TRPM7 and significantly reduce Ca2+ spark formation. (a) Heatmaps of Ca2+ sparking before (top) and after (bottom) application of inhibitors. (b) Number of Ca2+ hotspots per active cell (2-APB: n = 24 [pre] and n = 17 [post], p < 0.001; and waixenicin-A: n = 45 [pre] and n = 20 [post], p0.001; Mann–Whitney U-test, two-tailed). (c) Frequency distribution of number of hotspots per cell before and after application of inhibitors (2-APB: n = 24, p < 0.01; and waixenicin-A: n = 45, p0.001; McNemar's test for paired proportions, two-tailed). (d) Potent inhibition of Ca2+ spark activities at hotspots (indicated with arrows in a) following addition of 2-APB (see also Video 4) and waixenicin-A. Note that inhibition by waixenicin-A required preincubation for a few minutes. Data are mean ± SEM of at least 5 independent experiments. #p < 0.01, and **p < 0.0001.
Fig. 4
Fig. 4
Ca2+ hotspots do not localize specifically to invadosomes. (A)–(D) Four examples demonstrating the distribution of Ca2+ hotspots and invadosomes in N1E-115/TRPM7 cells. Invadosomes are visualized as bright actin dots, labeled with RFP-actin or Lifeact-dsRed (here in green). Shown in each panel is actin (top), Ca2+ hotspots (middle) and overlay (bottom). Please note that the minimum value of the LUT for the Ca2+ hotspot image in the overlay was adjusted to improve visualization of colocalization with invadosomes. Arrows indicate location of the Ca2+ traces in (b). In (A) Ca2+ hotspots are primarily located in the periphery, away from central invadosomes. In (B) Ca2+ hotspots appear along one side of the cell and are clearly excluded from invadosomes. In (C) several neighboring peripheral invadosomes (ROI 1 + 2) do not colocalize with Ca2+ hotspots. In (D) two peripheral invadosomes overlap with highly active Ca2+ hotspots (ROI 1 + 3), whereas others are mostly silent (ROI 2 + 4). As detailed in the text, statistical analysis reveals no significant colocalization of Ca2+ hotspots with invadosomes; thus, panels A–C are representative for the vast majority of observations whereas panel D presents a single outlier where some colocalization seems to occur. Scale bar = 20 μm.
Fig. 5
Fig. 5
Waixenicin-A treatment reverts TRPM7-mediated cell spreading and actomyosin-relaxation. (A) Top: effect of waixenicin-A treatment on cell spreading upon seeding. Bottom: quantification (mean ± SEM) of initial spreading at 30 and 50 min (p < 0.001 versus control, one-sample t-test. Experiments were repeated 5 times independently, each for at least 10 fields of view per condition). (B) Waixenicin-A causes cell contraction. Cell surface area was tracked over time by image analysis before and after application of waixenicin-A (0.75 μM and 4 μM). Traces (black, average response; gray, individual responses) were normalized to the cell surface area at the frame before application. (C) Top: effect of waixenicin-A treatment (added at t = 0) on invadosome numbers. Bottom: quantification (mean ± SEM) of invadosome dissolution at 10 and 20 min after application (2 μM, n = 5 fields of view; 0.75 μM, n = 15, counting hundreds of invadosomes per data point, p < 0.005 versus control, one-sample t-test). (D) Typical examples of confocal time-series experiments that show concentration-dependent invadosome dissolution upon waixenicin-A treatment (0.75 μM and 4 μM) in N1E-115/TRPM7 cells that stably express GFP-actin (see also Video 6). (E) Dose–response curve derived from the data in (C) at 20 min after application. (F) Examples of adherent N1E-115/TRPM7 cells treated with waixenicin-A (4 μM) or vehicle for 24 h. F-actin stained with Phalloidin-Alexa568. Note the induction of focal adhesions and stress fibers upon exposure to waixenicin-A (see zoom-in). Scalebar = 20 μm. *p < 0.001 and #p < 0.005.

References

    1. Kaverina I, Krylyshkina O, Small JV. Regulation of substrate adhesion dynamics during cell motility. Int. J. Biochem. Cell Biol. 2002;34:746–761. - PubMed
    1. Rottner K, Stradal TE. Actin dynamics and turnover in cell motility. Curr. Opin. Cell Biol. 2011;23:569–578. - PubMed
    1. Ridley AJ, Schwartz MA, Burridge K, Firtel RA, Ginsberg MH, Borisy G, Parsons JT, Horwitz AR. Cell migration: integrating signals from front to back. Science. 2003;302:1704–1709. - PubMed
    1. Burgstaller G, Gimona M. Actin cytoskeleton remodelling via local inhibition of contractility at discrete microdomains. J. Cell Sci. 2004;117:223–231. - PubMed
    1. Fukata Y, Amano M, Kaibuchi K. Rho-Rho-kinase pathway in smooth muscle contraction and cytoskeletal reorganization of non-muscle cells. Trends Pharmacol. Sci. 2001;22:32–39. - PubMed

Publication types