. 2013 Dec;14(12):1127-35.
doi: 10.1038/embor.2013.168. Epub 2013 Nov 1.

Loss of iron triggers PINK1/Parkin-independent mitophagy

Affiliations

Loss of iron triggers PINK1/Parkin-independent mitophagy

George F G Allen et al. EMBO Rep. 2013 Dec.

Abstract

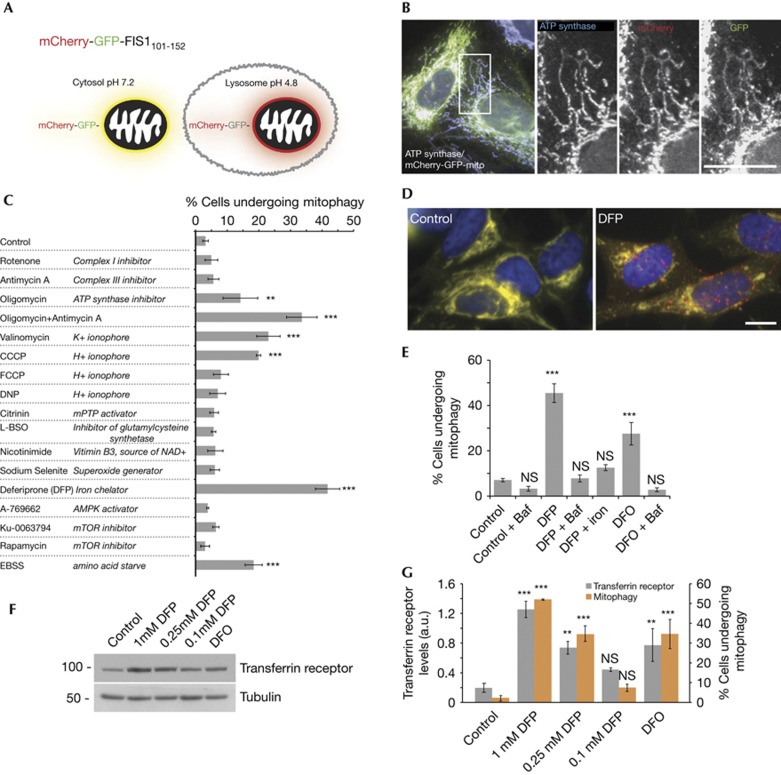
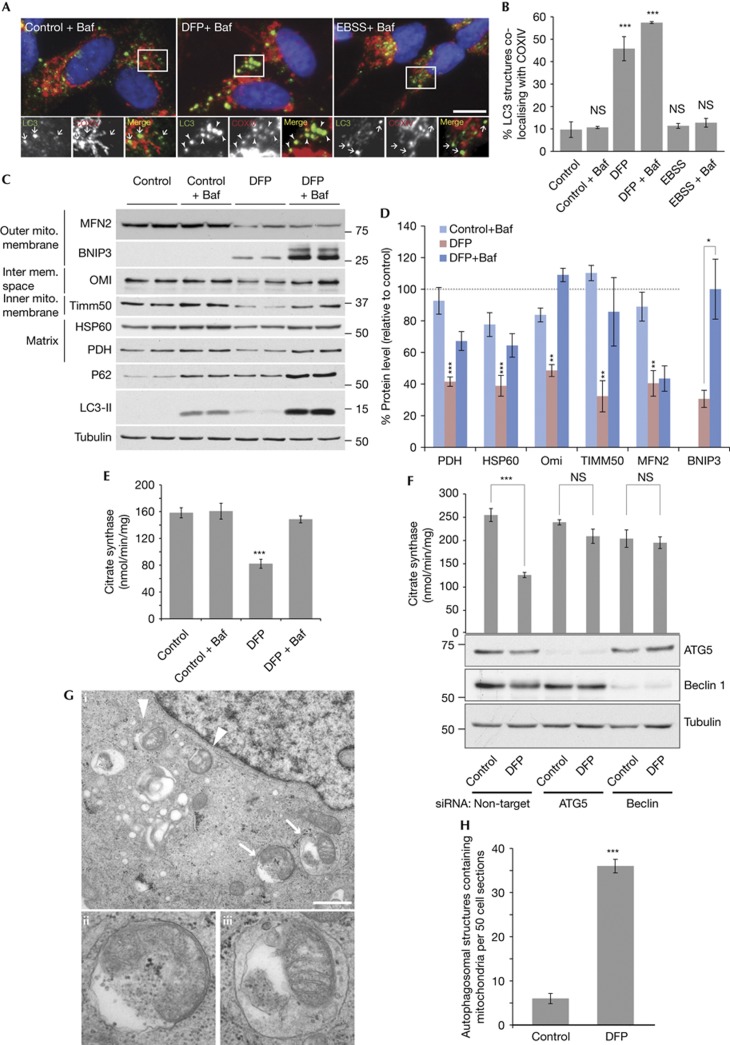
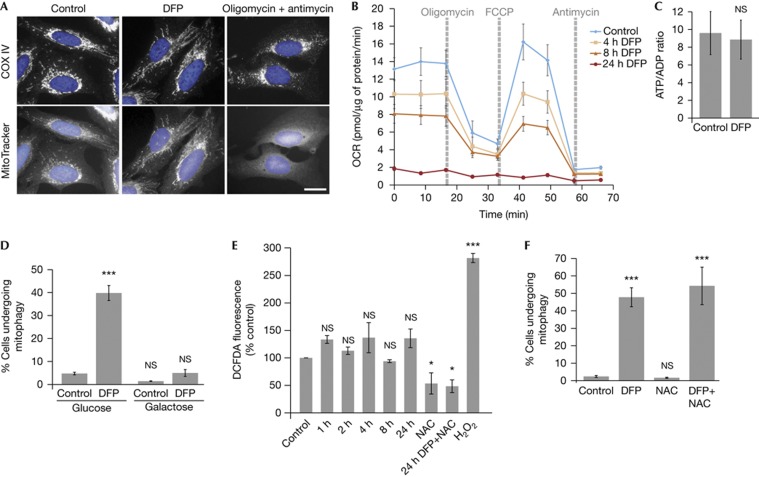
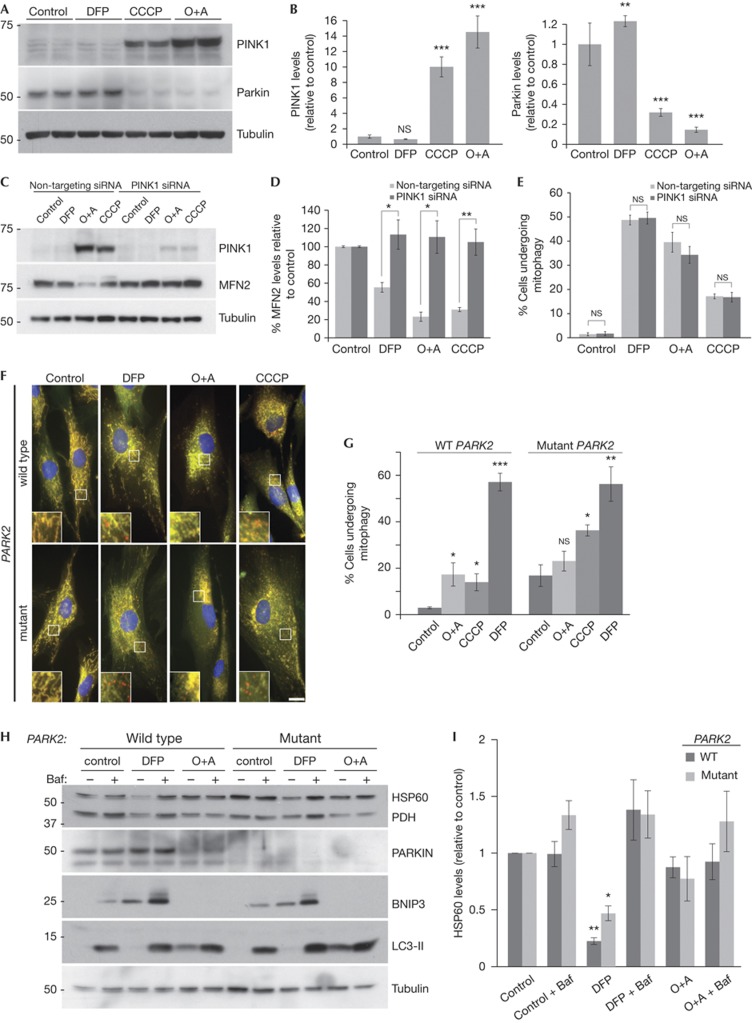
In this study, we develop a simple assay to identify mitophagy inducers on the basis of the use of fluorescently tagged mitochondria that undergo a colour change on lysosomal delivery. Using this assay, we identify iron chelators as a family of compounds that generate a strong mitophagy response. Iron chelation-induced mitophagy requires that cells undergo glycolysis, but does not require PINK1 stabilization or Parkin activation, and occurs in primary human fibroblasts as well as those isolated from a Parkinson's patient with Parkin mutations. Thus, we have identified and characterized a mitophagy pathway, the induction of which could prove beneficial as a potential therapy for several neurodegenerative diseases in which mitochondrial clearance is advantageous.


Conflict of interest statement

The authors declare that they have no conflict of interest.

Figures

Figure 1
Figure 1
A chemical screen for mitophagy inducers. (A) Diagram of tandem-tagged mCherry-GFP-FIS1101-152-based mitophagy assay. (B) Co-localization of mCherry-GFP-FIS1101-152 in U2OS cells with ATP synthase. (C) Screen for mitophagy inducing conditions using the tandem-tag mitophagy assay in SH-SY5Y cells. All treatments for 24 h. For this experiment, quantitation of mitophagy was performed with counter blinded to condition. (D) Example micrographs from cells expressing the mitophagy construct treated under control conditions or with 1 mM DFP for 24 h. (E) Results of mitophagy assay in SH-SY5Y cells following treatment with 1 mM DFP or deferoxamine for 24 h, 340 μM ferric ammonium citrate (iron) was preincubated with 1 mM DFP for 10 min before addition to cells. 100 nM bafilomycin A1 was added for final 4 h of incubation. (F) Representative blot and (G) Quantitation of transferrin receptor protein levels (left axis) and results of tandem-tag mitophagy assay (right axis) from SH-SY5Y cells treated with DFP at indicated concentration or 1 mM DFO for 24 h. All results are from 3–4 independent experiments. All quantitative data are mean±s.e.m. Scale bars, 10 μm. **P<0.01, ***P<0.001, NS, not significant. Baf, bafilomycin A1; DFO, deferoxamine; DFP, deferiprone; GFP, green fluorescent protein. Source data for this figure is available on the online supplementary information page.
Figure 2
Figure 2
Loss of iron induces mitophagy. (A) Representative images and (B) quantitation of SH-SY5Y cells stained with LC3 and COXIV antibodies, 1 mM DFP treatment for 16 h, EBSS (amino-acid starvation) for 2 h and 50 nM bafilomycin A1 for final 2 h of treatment. Arrows indicate non co-localized LC3 puncta and arrowheads co-localized puncta. Scale bar, 10 μm. (C) Example immunoblot and (D) Quantitation of mitochondrial proteins and autophagy markers in SH-SY5Y cells treated with 1 mM DFP for 24 h, 50 nM bafliomycin A1 was added for final 16 h of treatment. Data relative to control condition - dotted line represents control value (100%). (E) Citrate synthase activity following 1 mM DFP treatment for 24 h, 50 nM bafilomycin A1 was added for final 16 h of treatment. (F) Citrate synthase activity in HeLa cells after 1 mM DFP treatment for 24 h in cells transfected with siRNA against autophagy genes ATG5 or Beclin1. (G) Electron micrographs and (H) quantitation from SH-SY5Y cells treated under control conditions or with 1 mM DFP for 16 h each with 50 nM bafilomycin A1 for final 2 h of treatment. Arrows/arrowheads represent mitochondria surrounded by a limiting membrane. Structures labelled by arrows in panel i are shown magnified in ii (autophagosome) and iii (autolysosome). Scale bar represents 0.9 μm. All results are from three independent experiments. All quantitative data are mean±s.e.m. *P<0.05, **P<0.01, ***P<0.001, NS, not significant. Baf, bafilomycin A1; DFO, deferoxamine; DFP, deferiprone; EBSS, Earle’s balanced salt solution; GFP, green fluorescent protein; siRNA, small interfering RNA. Source data for this figure is available on the online supplementary information page.
Figure 3
Figure 3
Effects of iron chelation on mitochondrial function. (A) Representative COXIV immunostaining and Mitotracker staining of SH-SY5Y cells treated with 1 mM DFP or 10 μM oligomycin A+1 μM antimycin A for 24 h. Scale bar, 10 μm. (B) Oxygen consumption rate measured after treatment of SH-SY5Y cells with 1 mM DFP for the indicated length of time. 1 μM oligomycin A, 1 μM FCCP and 10 μM antimycin A were injected at the indicated times to determine the proportion of oxygen consumption due to ATP turnover, maximal rate of respiration and amount of proton leak respectively. (C) Ratio of ATP to ADP in SH-SY5Y cells treated with 1 mM DFP for 24 h. (D) Results of tandem-tag mitophagy assay in SH-SY5Y cells following treatment with 1 mM DFP in cells grown in glucose media or galactose media for 48 h before the addition of DFP. (E) Amount of ROS measured by DCFDA fluorescence in SH-SY5Y cells treated with 1 mM DFP for the indicated length of time. 5 mM N-acetylcysteine was added for 24 h where indicated. 0.1% H2O2 was added 5 min before measurement. (F) Mitophagy was measured using the tandem tag assay in SH-SY5Y cells treated with 1 mM DFP and/or 5 mM NAC for 24 h. All results are from three independent experiments. All quantitative data are mean±s.e.m. *P<0.05, ***P<0.001, NS, not significant. DFP, deferiprone; NAC, N-acetylcysteine; OCR, oxygen consumption rate; ROS, reactive oxygen species. Source data for this figure is available on the online supplementary information page.
Figure 4
Figure 4
Mitophagy is independent of PINK1 and Parkin. (A) Representative blot and (B) quantitation of PINK1 and Parkin protein levels in SH-SY5Y cells following treatment with 1 mM DFP, 20 μM CCCP or 10 μM oligomycin A+1 μM antimycin A (O+A) for 24 h. (C) Representative blot, (D) quantitation of MFN2 protein and (E) mitophagy assay from SH-SY5Y cells after treatment with 1 mM DFP, 20 μM CCCP or 10 μM oligomycin A+1 μM antimycin A (O+A) for 24 h in cells transfected with siRNA against PINK1 (F). Representative micrographs and (G) quantitation of human primary fibroblasts expressing the mCherry-GFP-FIS1101-152 construct from a control individual (wild type) and an early-onset Parkinson’s disease patient with compound heterozygous Parkin mutations (mutant). Cells were treated with 1 mM DFP, 20 μM CCCP or 10 μM oligomycin A+1 μM antimycin A (O+A) for 24 h. Scale bar, 10 μm. (H) Representative blots of mitochondrial proteins, the autophagy marker LC3 and Parkin and (I). Quantitation of HSP60 protein levels in Parkin wild type and mutant human primary fibroblasts treated with 1 mM DFP or 10 μM oligomycin A+1 μM antimycin A (O+A) for 24 h, 50 nM bafilomycin A1 was added for the final 16 h of treatment. All results are from three independent experiments. All quantitative data are mean±s.e.m. *P<0.05, **P<0.01, ***P<0.001, NS, not significant. DFP, deferiprone; GFP, green fluorescent protein; MFN2, mitofusin2; siRNA, small interfering RNA. Source data for this figure is available on the online supplementary information page.

Comment in

  • The many faces of mitophagy.
    Ivatt RM, Whitworth AJ. Ivatt RM, et al. EMBO Rep. 2014 Jan;15(1):5-6. doi: 10.1002/embr.201338224. EMBO Rep. 2014. PMID: 24398127 Free PMC article.

References

    1. Nunnari J, Suomalainen A (2012) Mitochondria: in sickness and in health. Cell 148: 1145–1159 - PMC - PubMed
    1. Wang K, Klionsky DJ (2011) Mitochondria removal by autophagy. Autophagy 7: 297–300 - PMC - PubMed
    1. Dutta D et al. (2012) Contribution of impaired mitochondrial autophagy to cardiac aging: mechanisms and therapeutic opportunities. Circ Res 110: 1125–1138 - PMC - PubMed
    1. Green DR, Galluzzi L, Kroemer G (2011) Mitochondria and the autophagy-inflammation-cell death axis in organismal aging. Science 333: 1109–1112 - PMC - PubMed
    1. Rubinsztein DC, Marino G, Kroemer G (2011) Autophagy and aging. Cell 146: 682–695 - PubMed

Publication types