. 2013 Dec;136(Pt 12):3796-808.
doi: 10.1093/brain/awt276. Epub 2013 Oct 30.

Ictal high frequency oscillations distinguish two types of seizure territories in humans

Affiliations

Ictal high frequency oscillations distinguish two types of seizure territories in humans

Shennan A Weiss et al. Brain. 2013 Dec.

Abstract

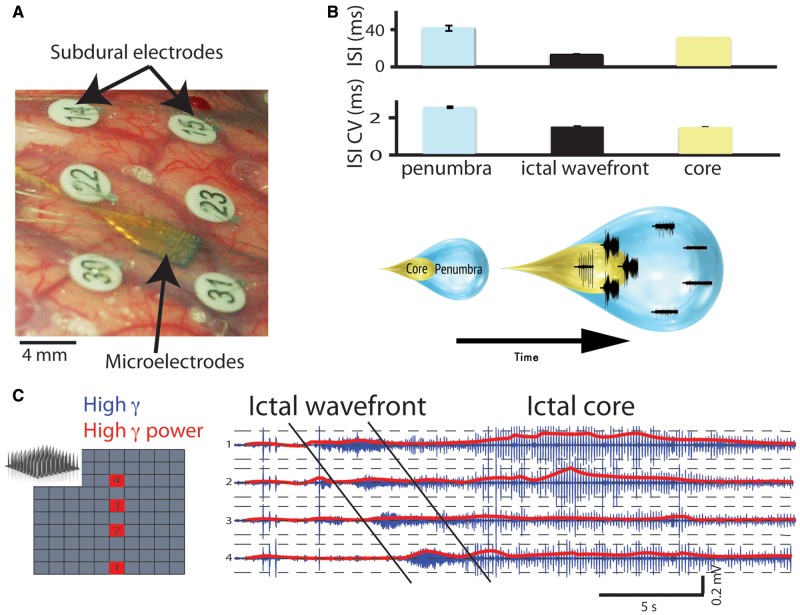
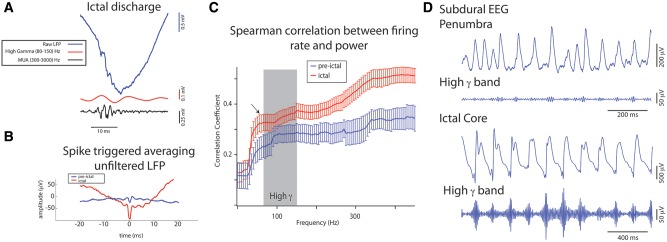
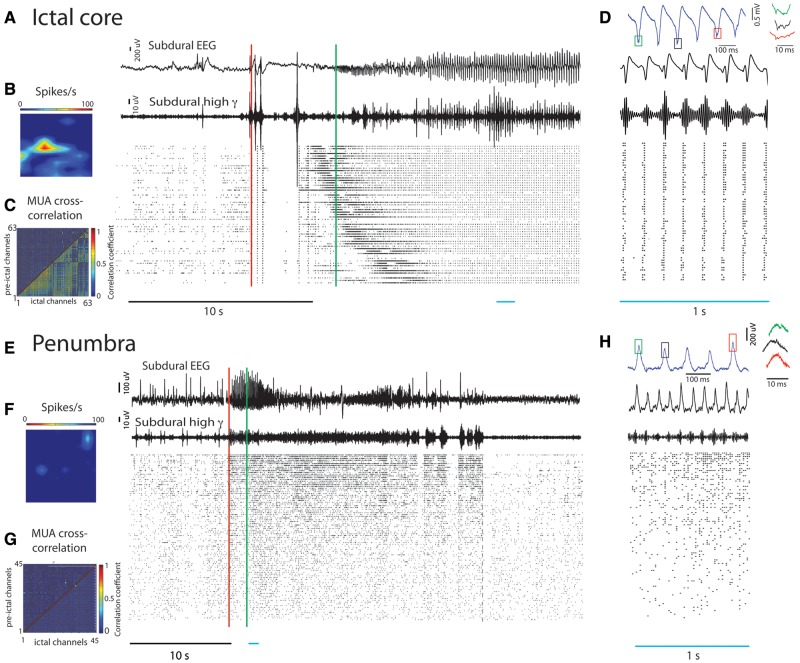
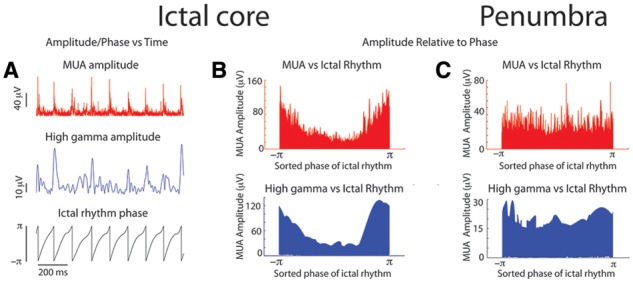
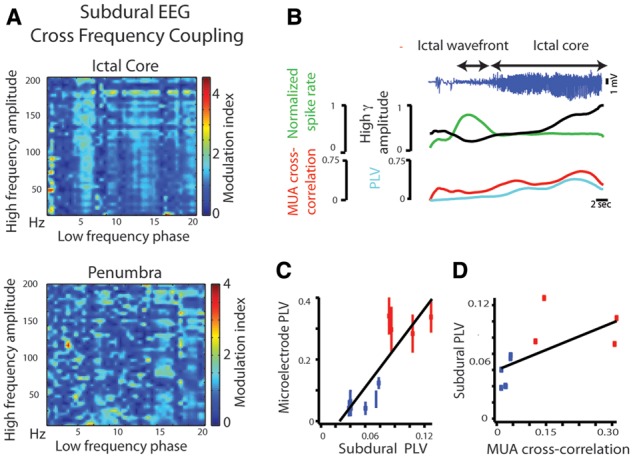
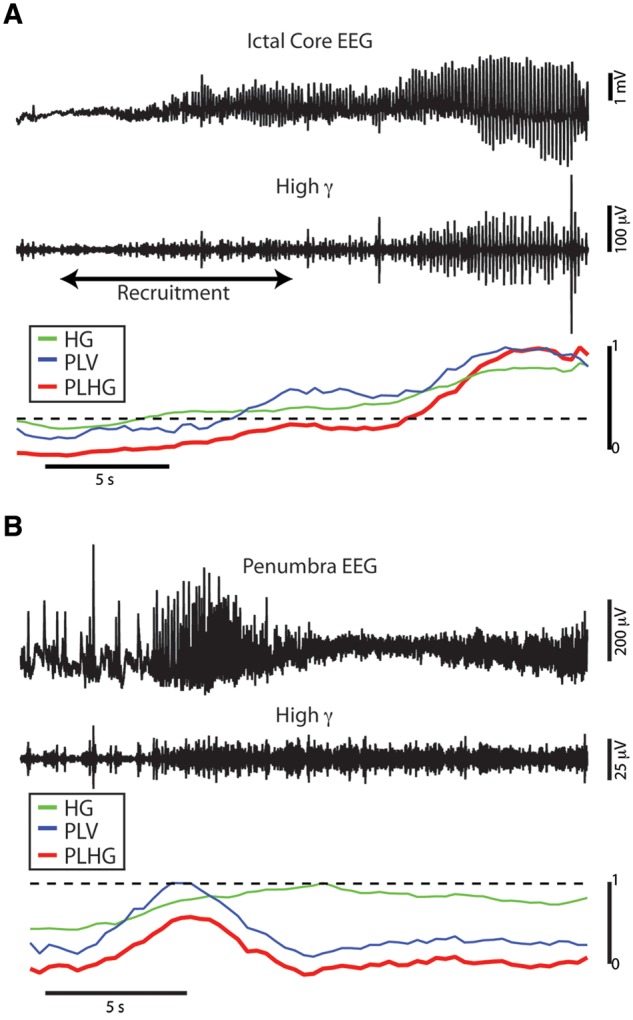
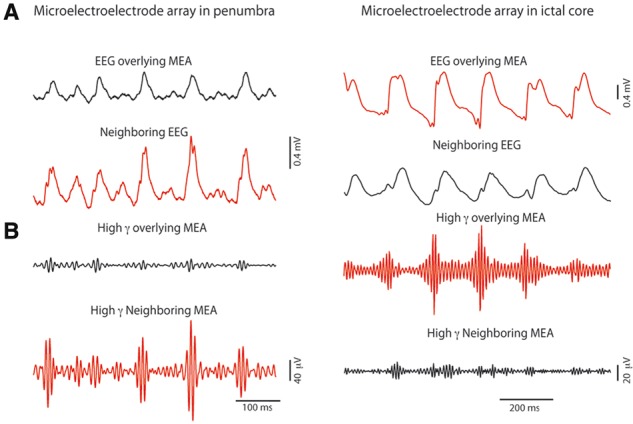
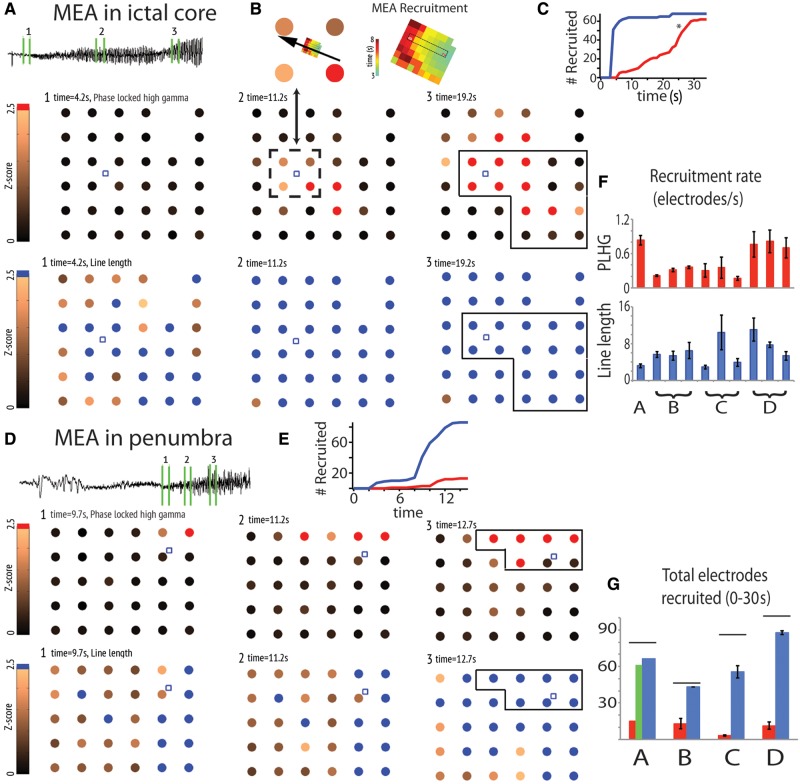
High frequency oscillations have been proposed as a clinically useful biomarker of seizure generating sites. We used a unique set of human microelectrode array recordings (four patients, 10 seizures), in which propagating seizure wavefronts could be readily identified, to investigate the basis of ictal high frequency activity at the cortical (subdural) surface. Sustained, repetitive transient increases in high gamma (80-150 Hz) amplitude, phase-locked to the low-frequency (1-25 Hz) ictal rhythm, correlated with strong multi-unit firing bursts synchronized across the core territory of the seizure. These repetitive high frequency oscillations were seen in recordings from subdural electrodes adjacent to the microelectrode array several seconds after seizure onset, following ictal wavefront passage. Conversely, microelectrode recordings demonstrating only low-level, heterogeneous neural firing correlated with a lack of high frequency oscillations in adjacent subdural recording sites, despite the presence of a strong low-frequency signature. Previously, we reported that this pattern indicates a failure of the seizure to invade the area, because of a feedforward inhibitory veto mechanism. Because multi-unit firing rate and high gamma amplitude are closely related, high frequency oscillations can be used as a surrogate marker to distinguish the core seizure territory from the surrounding penumbra. We developed an efficient measure to detect delayed-onset, sustained ictal high frequency oscillations based on cross-frequency coupling between high gamma amplitude and the low-frequency (1-25 Hz) ictal rhythm. When applied to the broader subdural recording, this measure consistently predicted the timing or failure of ictal invasion, and revealed a surprisingly small and slowly spreading seizure core surrounded by a far larger penumbral territory. Our findings thus establish an underlying neural mechanism for delayed-onset, sustained ictal high frequency oscillations, and provide a practical, efficient method for using them to identify the small ictal core regions. Our observations suggest that it may be possible to reduce substantially the extent of cortical resections in epilepsy surgery procedures without compromising seizure control.

Keywords: epilepsy surgery; high frequency oscillations; human microelectrode recordings; seizure localization.


Figures

Figure 1
Figure 1
High gamma oscillations reflect neuronal firing patterns during a seizure. (A) Photograph of the recording arrangement in an epilepsy patient undergoing intracranial EEG monitoring. The subdural electrodes (numbered) surround the microelectrode array (arrow). (B) Schematic of the two distinct seizure territories, the core and penumbra. At any given moment, one can distinguish between the two territories on the basis of neuronal firing statistics such as inter-spike interval (ISI) and the coefficient of variation (CV) of the inter-spike interval. These territories expand as the seizure progresses. (C) Progression of the ictal wavefront across the microelectrode array (schematic, selected electrodes shown in red). High gamma filtered activity (blue) and high gamma power (red) are shown for each of the four electrodes. Note the periodic bursts in high gamma activity following passage of the ictal wavefront (diagonal black lines).
Figure 2
Figure 2
Ictal high gamma activity is tightly associated with unit activity and can be detected with subdural electrodes. (A) High gamma oscillations (red) and multi-unit activity (MUA, black) coincide during an ictal spike recorded by a microelectrode before filtering (blue). (B) Spike triggered averaging of the unfiltered local field potential (LFP) recorded by a microelectrode in the ictal core during pre-ictal (blue, n = 109 spikes) and ictal (red, n = 204 spikes) epochs. (C) Mean absolute Spearman rank correlation (r) of the linear fit between multi-unit firing rate and power (1–500 Hz) calculated in 5 Hz bins during the 10 s pre-ictal interval (blue, n = 10), and during the seizure (red, n = 10). The correlation during the ictal epoch reaches statistical significance at 62 Hz (arrow), just below the lower limit of the high gamma frequency band (shaded). (Spearman rank correlation, n = 101 spectral bins, 80–200 temporal bins, 423 microelectrodes, P < 0.001, Bonferroni corrected). The ictal correlation coefficients were increased compared with the pre-ictal baseline [one-way ANOVA, F (19,100) = 127.3, P < 0.001]. (D) Unfiltered and high gamma band pass filtered ictal recordings from the subdural electrode overlying the microelectrode array from two patients. Increased high gamma amplitude is visible at the negative peak of the low-frequency rhythm in the broadband signal recorded in the ictal core (Patient B) but not in the penumbral recording (Patient C).
Figure 3
Figure 3
Hypersynchronization is evident in the ictal core but not the penumbra. (A–D) Analysis of ictal core activity. (A) EEG recorded from a subdural electrode adjacent to the microelectrode array in Patient A. Note the high gamma bursts developing late in the seizure (onset indicated by red line). (B) Raster plot of detected action potentials, sorted in order of recruitment and time-locked to the EEG. Spatial map of multi-unit firing at the time indicated by the green vertical line demonstrating the propagating ictal wavefront (left). (C) Multi-unit cross correlation coefficient measured during the 30 s pre-ictal interval (upper diagonal) and during the seizure (lower diagonal). (D) Top: Ictal microelectrode recording illustrating high frequency oscillations (right) at the negative peak of the low-frequency rhythm (coloured squares). Bottom: Enlarged timescale of the period indicated by the blue bar. Note the extreme hypersynchrony across all microelectrode channels, with high gamma amplitude peaks aligning with negative peaks of the low-frequency ictal rhythm. (E–H) Similar presentation of penumbral activity. (E) EEG recorded from subdural electrode partially overlying the microelectrode array in Patient C. The corresponding high gamma band pass filtered signal does not demonstrate the bursting present in A and D. Corresponding raster plot showing the absence of an ictal wavefront and ictal core stage. (F) Spatial map of multi-unit firing at time indicated by the green arrow fails to identify a propagating wavefront. (G) Multi-unit cross correlation coefficients as in (C). (H) Top: Closer examination of the positive peaks, to which small high gamma transients were aligned, reveals no oscillatory activity. Interval indicated by blue bar at higher temporal resolution demonstrating minimal amplitude modulation of the high gamma band relative to the phase of the ictal rhythm, and no phase-locking of units. MUA = multi-unit activity.
Figure 4
Figure 4
Hierarchical cross frequency coupling between the ictal rhythm, high gamma, and multi-unit activity is evident in the ictal core, but not in the penumbra. (A) One second intervals of the instantaneous phase of the ictal rhythm from a microelectrode recording of ictal core activity (bottom). Corresponding instantaneous high gamma (middle) and multi-unit (top) amplitude during this epoch. (B) For the entire duration of the microelectrode recording of the ictal core the instantaneous phase was sorted (bottom) and the permutation vector was applied to the amplitude of the high gamma band (middle) and the amplitude of the multi-unit activity (top). (C) This same analysis was applied to the entire duration of a microelectrode recording from the penumbra but no clear relationship to low frequency phase was evident.
Figure 5
Figure 5
Cross frequency coupling in subdural EEG seizure recordings. (A) Cross frequency coupling as quantified by the modulation index (see ‘Materials and methods’ section). The top plot shows a seizure recording from a subdural electrode overlying the ictal core, as defined by multi-unit firing from the microelectrode array. Note that the modulation is maximal between the phase of the ictal rhythm (prominent vertical band at ∼5–7 Hz and harmonics) and the high gamma band (∼90–180 Hz). In contrast, cross-frequency coupling is not prominent in a recording from the penumbra in another patient. The ictal rhythm in this case is in the 10–12 Hz range. (B) Linear correlation of subdural EEG and microelectrode local field potential phase-locking value (PLV), another measure of cross frequency coupling between high gamma (80–150 Hz) and lower frequencies (4–30 Hz), for seizures recorded from the ictal core (red, n = 4), and the penumbra (blue, n = 6), showing clear distinction between the two regions. (C) Subdural high gamma amplitude (black) departs significantly from the normalized multi-unit firing rate (green) during a seizure (blue, top), while subdural phase-locking value (cyan) closely tracks multi-unit cross-correlation (red). (D) Linear correlation between subdural phase-locking value and multi-unit activity correlation coefficient for seizures recorded from the ictal core (red, n = 4), and the penumbra (blue, n = 6).
Figure 6
Figure 6
The phase-locked high gamma metric as a measure of high gamma amplitude weighted by low frequency coupling. (A) Seizure recorded from a subdural electrode in the ictal core adjacent to the microelectrode array, showing wideband EEG (top) and 80–150 Hz filtered signal (middle). The bottom plot shows corresponding normalized traces of high gamma amplitude (HG, green), phase-locking value between the ictal rhythm and the high gamma band (PLV, blue), and phase-locked high gamma amplitude (PLHG, red). The dotted line indicates a Z-scored PLHG value of 2.5. Note that the PLHG measure accurately tracks high gamma amplitude coupled to the phase of the ictal rhythm, and that high gamma amplitude increases can be seen before recruitment as indicated by the microelectrode recording (black arrows). (B) Similar recording from a subdural electrode overlying the microelectrode array, at a site showing only penumbral activity.
Figure 7
Figure 7
Sharp spatial gradients in low-frequency coupled high gamma amplitude, but not in low frequency EEG. (A) Wideband EEG recorded from pairs of subdural electrodes (1 cm separation), with one electrode in each pair overlying the microelectrode array (MEA), in two patients, one with the microelectrode array situated in penumbra (left), and one with the array located in a recruited area (right). In each case, penumbral (definite or presumed) sites are indicated by black traces, and ictal core by red traces. Signal from the electrodes overlying the microelectrode array is slightly attenuated, due to partial blockage of the recording area. Otherwise, the tracings are similar. (B) High gamma bandpass filtered signal from the same pairs of electrodes during the time epochs indicated by the black bars, demonstrating amplitude modulated high gamma in the ictal core but not in the adjacent penumbra.
Figure 8
Figure 8
Mapping seizure activity using the phase-locked high gamma metric. Subdural electrode grids in Patient A (A–C) and Patient D (D–E), with the location of the microelectrode array (MEA) indicated by the small blue box and the seizure onset zone outlined in black. The copper colour scale indicates the z-scored PLHG (A and D, above), and z-scored line length (A and D, below) relative to the pre-ictal baseline, capped at the threshold value of 2.5 as indicated by the colours red (PLHG) and blue (line length). (A and D) PLHG (top) and line length (bottom) values at three time intervals during the seizure denoted by the green numbered bars superimposed on the corresponding EEG. Note that the spread of PLHG was spatially contiguous, with a clear area of origin and path of propagation. The site of the microelectrode array was incorporated into the PLHG-defined core region in Patient A, but not in Patient D, matching the site classification afforded by the multi-unit recordings. (B) The direction of spread was also consistent with the direction of ictal wavefront propagation recorded from Patient A, judged from MUA firing rate peak latencies and correlating array placement using the intraoperative photo in Fig. 1A. (C and E) Plot of the total number of subdural electrodes recruited into the seizure by each measure as a function of time. The asterisk indicates approximate time of secondary generalization, based on clinical semiology. (F) Summary bar graph of the recruitment rate by PLHG (red) and line length (blue) for the 10 seizures recorded from the four patients. Error bars indicate 95% confidence intervals. (G) Bar plot of the percentage of total electrodes that were recruited into the ictal core or penumbra for each of the four patients. For Patient A, the red bar indicates PLHG recruitment up to the point of secondary generalization, and the green bar indicates total PLHG recruitment.

References

    1. Alarcon G. Power spectrum and intracranial EEG patterns at seizure onset in partial epilepsy. Electroencephalogr Clin Neurophysiol. 1995;94:326–37. - PubMed
    1. Babb TL, Wilson CL, Isokawa-Akesson M. Firing patterns of human limbic neurons during stereoencephalography (SEEG) and clinical temporal lobe seizures. Electroencephalogr Clin Neurophysiol. 1987;66:467–482. - PubMed
    1. Bénar CG, Chauvière L, Bartolomei F, Wendling F. Pitfalls of high-pass filtering for detecting epileptic oscillations: a technical note on “false” ripples. Clin Neurophysiol. 2010;121:301–10. - PubMed
    1. Berenyi A, Belluscio M, Mao D, Buzsaki G. Closed-loop control of epilepsy by transcranial electrical stimulation. Science. 2012;337:735–7. - PMC - PubMed
    1. Blumenfeld H, Varghese GI, Purcaro MJ, Motelow JE, Enev M, McNally KA, et al. Cortical and subcortical networks in human secondarily generalized tonic-clonic seizures. Brain. 2009;132:999–1012. - PMC - PubMed

Publication types