. 2014 Feb;31(2):288-302.
doi: 10.1093/molbev/mst211. Epub 2013 Oct 30.

Origin and differential selection of allelic variation at TAS2R16 associated with salicin bitter taste sensitivity in Africa

Affiliations

Origin and differential selection of allelic variation at TAS2R16 associated with salicin bitter taste sensitivity in Africa

Michael C Campbell et al. Mol Biol Evol. 2014 Feb.

Abstract

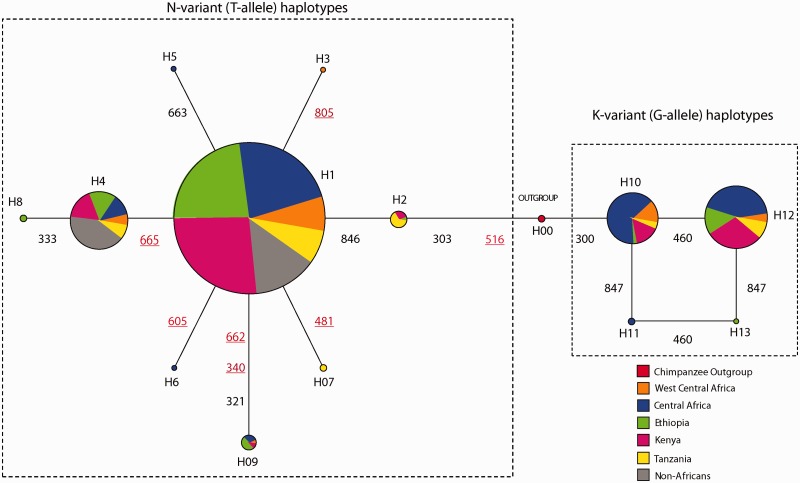
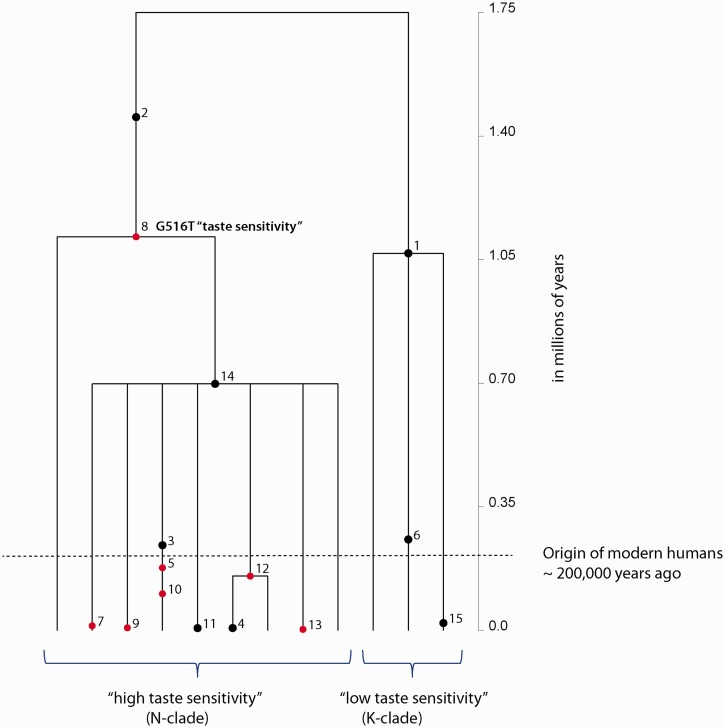
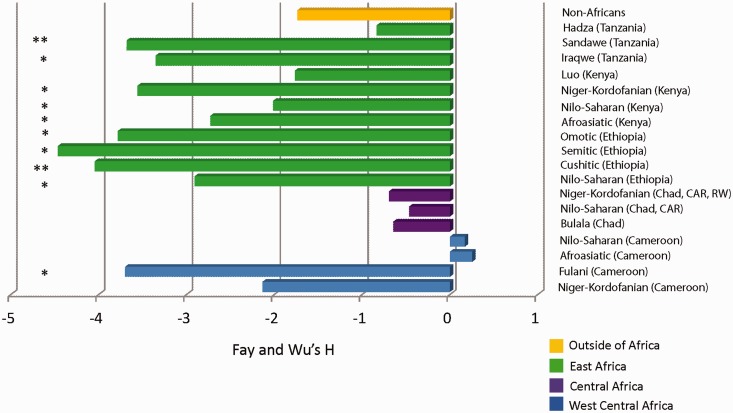
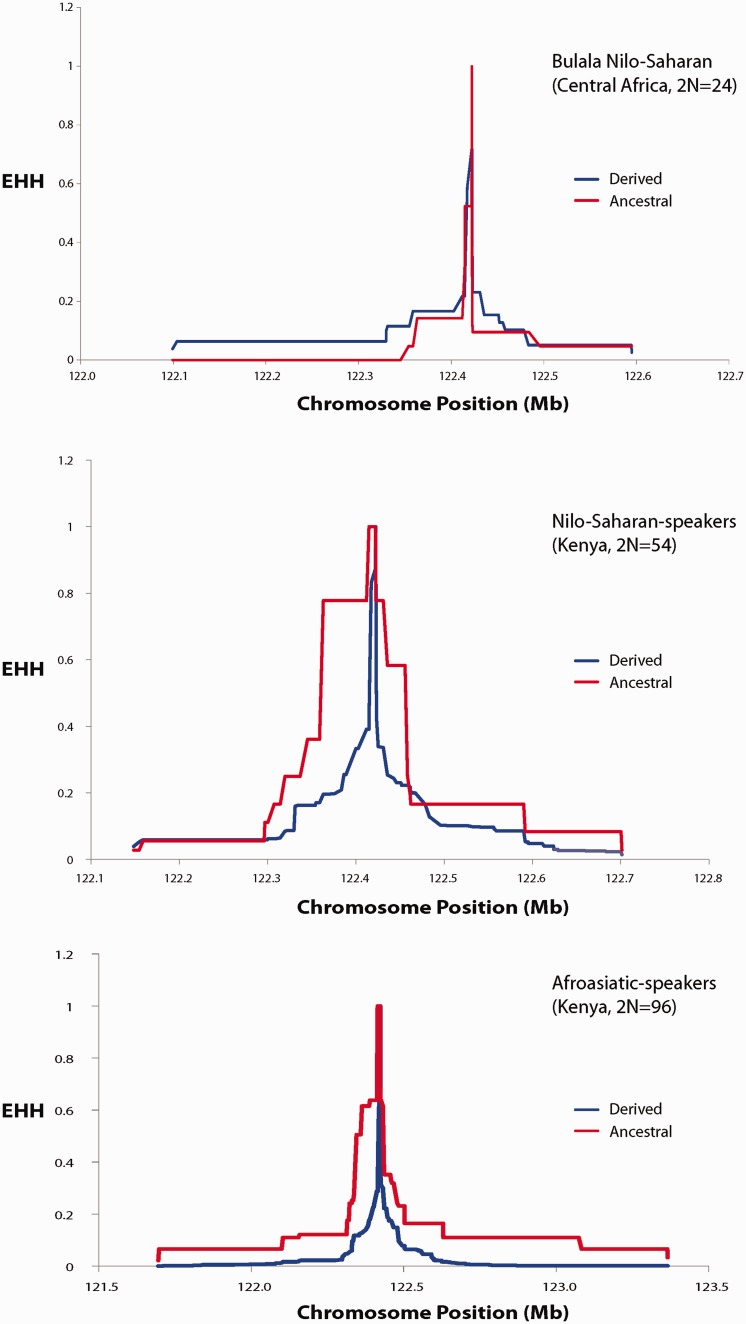
Bitter taste perception influences human nutrition and health, and the genetic variation underlying this trait may play a role in disease susceptibility. To better understand the genetic architecture and patterns of phenotypic variability of bitter taste perception, we sequenced a 996 bp region, encompassing the coding exon of TAS2R16, a bitter taste receptor gene, in 595 individuals from 74 African populations and in 94 non-Africans from 11 populations. We also performed genotype-phenotype association analyses of threshold levels of sensitivity to salicin, a bitter anti-inflammatory compound, in 296 individuals from Central and East Africa. In addition, we characterized TAS2R16 mutants in vitro to investigate the effects of polymorphic loci identified at this locus on receptor function. Here, we report striking signatures of positive selection, including significant Fay and Wu's H statistics predominantly in East Africa, indicating strong local adaptation and greater genetic structure among African populations than expected under neutrality. Furthermore, we observed a "star-like" phylogeny for haplotypes with the derived allele at polymorphic site 516 associated with increased bitter taste perception that is consistent with a model of selection for "high-sensitivity" variation. In contrast, haplotypes carrying the "low-sensitivity" ancestral allele at site 516 showed evidence of strong purifying selection. We also demonstrated, for the first time, the functional effect of nonsynonymous variation at site 516 on salicin phenotypic variance in vivo in diverse Africans and showed that most other nonsynonymous substitutions have weak or no effect on cell surface expression in vitro, suggesting that one main polymorphism at TAS2R16 influences salicin recognition. Additionally, we detected geographic differences in levels of bitter taste perception in Africa not previously reported and infer an East African origin for high salicin sensitivity in human populations.

Keywords: African genetic diversity; genotype–phenotype association; salicin taste perception; selection on standing variation.


Figures

F<sc>ig</sc>. 1.
Fig. 1.
Inferred haplotype relationships for global populations. Haplotype relationships were constructed using Network 4.15 (Bandelt et al. 1999). The circles represent haplotypes and the size of the circles is proportional to the number of chromosomes with a given haplotype. Colors within each haplotype represent the proportion of chromosomes with that haplotype within a population or geographic region. The alpha/numerical label beside each haplotype is the designated name of each haplotype. The numbers and lines between haplotypes represent the nucleotide position of mutations that differentiate haplotypes.
F<sc>ig</sc>. 2.
Fig. 2.
MDS plots of allele frequencies for genome-wide and TAS2R16 data in African populations. The MDS plots indicate the spatial configuration of diverse African populations, represented by different symbols, based on pairwise FST calculated (A) from genome-wide SNP data genotyped using the Illumina 1 M Duo platform and (B) from SNPs ascertained through resequencing of the TAS2R16 gene in similar sets of African populations. The circles encompassing populations represent groups of populations that clustered together based on pairwise FST estimates. For the genome-wide SNP data set in (A), geographic region from which populations originated is given in parentheses, whereas for the TAS2R16 data set in (B), linguistic affiliation is indicated in parentheses.
F<sc>ig</sc>. 3.
Fig. 3.
Inferred TMRCA of global variation and individual ages of mutations at TAS2R16. A gene tree describing the mutation history or genealogy of polymorphisms in the coding region of TAS2R16 was constructed using a coalescent-based method implemented in GENETREE (Griffiths 2007). The TMRCA and ages of polymorphisms are mean estimates with standard deviations listed in supplementary table S10, Supplementary Material online. The scale (in millions of years) is along the vertical axis of this figure. Dots represent mutations, and the numbers beside each dot are the designated identifier for each polymorphism given by the GENETREE program. The red dots indicate nonsynonymous variants, while black dots signify synonymous variation. We also indicated the polymorphic variation associated with salicin bitter taste (G516T). The dashed horizontal line represents the origin of anatomically modern humans ∼200,000 years ago.
F<sc>ig</sc>. 4.
Fig. 4.
A plot of observed Fay and Wu’s H values. Bars in the plot represent Fay and Wu’s H statistics, based on the site frequency spectrum, in the intronless coding region of TAS2R16 in global populations using DnaSP (Librado and Rozas 2009). Populations are listed in close proximity to each bar, and colors of the bars denote the geographic region from where our population samples originated. Within parentheses, CAR and RW represent Central African Republic and Rwanda, respectively. The * and ** symbols indicate statistical significance at P < 0.05 and P ≤ 0.01, respectively, under an assumption of constant population size.
F<sc>ig</sc>. 5.
Fig. 5.
EHH plots for selected African populations. These plots show the decay of haplotype homozygosity with increasing distance from the core SNP represented here as the derived and ancestral alleles at nucleotide position 516 in the TAS2R16 gene. The x axis is the chromosome position of SNPs spanning chromosome 7 and the y axis is the probability that two chromosomes are homozygous at all SNPs for the entire interval from the core region to distance x. EHH = 0 means all extended haplotypes are different, while EHH = 1 indicates that all extended haplotypes are the same. In our plot, the red line represents the decay of homozygosity of chromosomes carrying the derived allele at the core, while the blue line signifies the decay of homozygosity on chromosomes bearing the ancestral core allele.

References

    1. Bamshad M, Wooding SP. Signatures of natural selection in the human genome. Nat Rev Genet. 2003;4:99–111. - PubMed
    1. Bandelt HJ, Forster P, Rohl A. Median-joining networks for inferring intraspecific phylogenies. Mol Biol Evol. 1999;16:37–48. - PubMed
    1. Barrett JC, Fry B, Maller J, Daly MJ. Haploview: analysis and visualization of LD and haplotype maps. Bioinformatics. 2005;21:263–265. - PubMed
    1. Barrett RD, Schluter D. Adaptation from standing genetic variation. Trends Ecol Evol. 2008;23:38–44. - PubMed
    1. Bufe B, Breslin PAS, Kuhn C, Reed DR, Tharp CD, Slack JP, Kim UK, Drayna D, Meyerhof W. The molecular basis of individual differences in phenylthiocarbamide and propylthiouracil bitterness perception. Curr Biol. 2005;15:322–327. - PMC - PubMed

Publication types

MeSH terms

LinkOut - more resources