. 2013:4:2718.
doi: 10.1038/ncomms3718.

Tumour-on-a-chip provides an optical window into nanoparticle tissue transport

Affiliations

Tumour-on-a-chip provides an optical window into nanoparticle tissue transport

Alexandre Albanese et al. Nat Commun. 2013.

Abstract

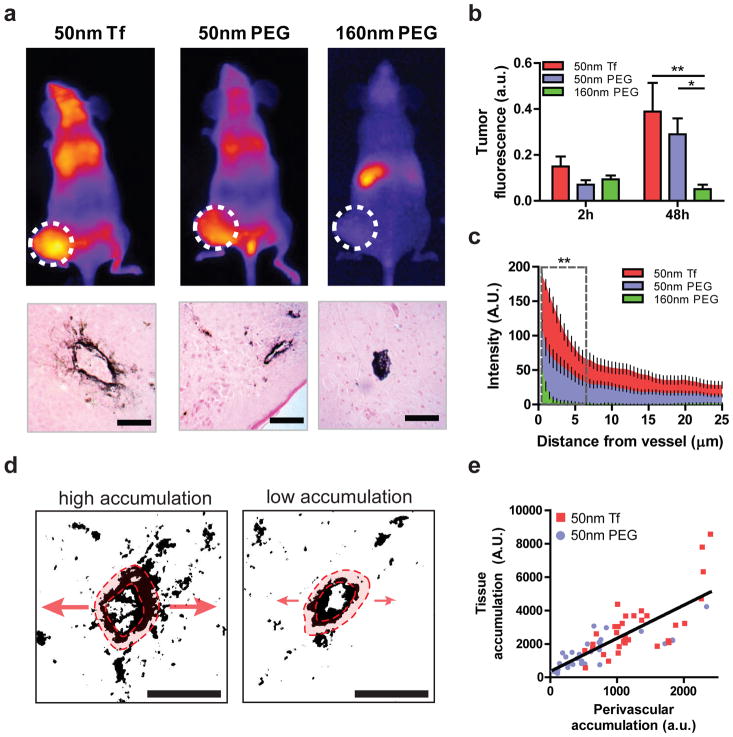
Nanomaterials are used for numerous biomedical applications, but the selection of optimal properties for maximum delivery remains challenging. Thus, there is a significant interest in elucidating the nano-bio interactions underlying tissue accumulation. To date, researchers have relied on cell culture or animal models to study nano-bio interactions. However, cell cultures lack the complexity of biological tissues and animal models are prohibitively slow and expensive. Here we report a tumour-on-a-chip system where incorporation of tumour-like spheroids into a microfluidic channel permits real-time analysis of nanoparticle (NP) accumulation at physiological flow conditions. We show that penetration of NPs into the tissue is limited by their diameter and that retention can be improved by receptor targeting. NP transport is predominantly diffusion-limited with convection improving accumulation mostly at the tissue perimeter. A murine tumour model confirms these findings and demonstrates that the tumour-on-a-chip can be useful for screening optimal NP designs prior to in vivo studies.


Conflict of interest statement

Competing financial interests

The authors declare no competing financial interests.

Figures

Figure 1
Figure 1. Schematic and characterisation of the tumour-on-a-chip
(a) Schematic of the PDMS microfluidic device on a microscope stage. (b) Image of the microfluidic device (left panel) demonstrating that channel width is 600μm at the inlet then widens to 1200 μm in the imaging chamber where the spheroid is immobilized. Channel height is 250 μm and then drops to 25 μm at the end of the imaging chamber forming a dam; scale bar = 1000 μm. A spheroid (right panel) stained with anti-Laminin-FITC for 10 min and then flushed with imaging media for 5 min; scale bar = 100 μm. (c) Flow rate versus media exchange (black squares) which represents the amount of time required for the non-fluorescent media inside the spheroid to be filled with 10kDa Dextran-568. The corresponding interstitial flow rates (red diamonds) are displayed. Error bars represent s.e.m. where n = 3 experiments.
Figure 2
Figure 2. Effect of nanoparticle size on tissue accumulation
(a) Schematic (left) and image (right) of 40nm fluorescent PEG-NPs administered for 1 h at 50 μl h−1 entering the spheroid and accumulate in the interstitial spaces (arrows). Scale bar = 100 μm (b) Schematic (left) and image (right) of 110 nm fluorescent PEG-NPs administered for 1 h at 50 μl h−1 being excluded from the spheroid. Scale bar = 100 μm. Images in a and b represent an overlay of fluorescence (excitation: 633 nm, emission: 650–700 nm) and differential interference contrast images. (c) Tissue accumulation of different 40 (red), 70 (blue), 110 (green) and 150 nm (orange) PEG-NPs administered to the spheroid at 50μl h−1. (d) Tissue accumulation of PEG-NPs after 1 h at 50μl h−1 and after flushing with clear solution for 30 min at 50μl h−1. Tissue accumulation represents the average fluorescent intensity from the spheroid’s perimeter to a depth of 75 μm normalized to the medium’s fluorescence. Data is presented as the average values from 3–5 spheroids with s.e.m. *** p<0.001 using ANOVA.
Figure 3
Figure 3. Effect of nanoparticle functionalization and flow rate
(a) Intensity map (top) of PEG-NP fluorescence taken at 40X after 1 h of flow at 50 μl h−1. Image (bottom) of PEG-NP fluorescence in the interstitial spaces (arrows). Scale bars = 50 μm. (b) Mean fluorescence of surrounding matrix [ECM] and spheroid [sphr] treated with PEG-NPs at 50 μl h−1. (c) Intensity map (top) of Tf-NP fluorescence taken after 1 h of flow at 50 μl h−1. Image (bottom) of Tf-NP punctuate fluorescence co-localizing with cell membranes. Scale bars = 50 μm. (d) Mean fluorescence of surrounding matrix and spheroid treated with Tf-NPs at 50 μl h−1. Mean spheroid fluorescence (e), fluorescence distribution (f) and penetration depth (g) of spheroids treated with PEG-NPs at various flow rates. Mean spheroid fluorescence (h), fluorescence distribution (i) and penetration depth (j) of spheroids treated with Tf-NPs at various flow rates. Data is presented as the average values from 3–5 spheroids with s.e.m. *p<0.05, **p<0.01 using ANOVA.
Figure 4
Figure 4. In vivo behavior of nanoparticles
(a) Representative images (top) of tumour fluorescence from mice injected with NPs in the tail vein at 48h post-injection and sample images (bottom) of tumour histological sections treated with a silver enhancement kit to visualize NPs around blood vessels. The 50 nm Tf-NPs and 50 nm PEG NPs diffuse into the tissue, while 160 nm PEG-NPs remain inside the blood vessel. Scale bars = 50μm. (b) Quantification of animal fluorescence at 2 and 48h using whole animal images (n=3; *p<0.05, **p<0.01 using two-way ANOVA). (c) Distribution of NPs in tumour blood vessels quantified using image analysis of silver-stained histological sections (n=33 for 50 nm NPs and n=15 for 160 nm NPs; **p<0.01 using two-way ANOVA). (d) Representative image of two distinct blood vessels in the same tumour treated with 50nm PEG-NP demonstrating variability in extravasation and tissue penetration. Image threshold was set to isolate silver-stained NPs in the tissue. Red highlighted area corresponds to the perivascular region. Scale bars = 25μm (e) Correlation between accumulation of NPs in the perivascular region (5μm radius) and the tumour tissue (25μm radius) around the blood vessel.

References

    1. Davis ME, Chen Z, Shin DM. Nanoparticle therapeutics: an emerging treatment modality for cancer. Nat Rev Drug Discov. 2008;7:771–782. - PubMed
    1. Thurber GM, Schmidt MM, Wittrup KD. Factors determining antibody distribution in tumors. Trends in Pharmacological Sciences. 2008;29:57–61. - PMC - PubMed
    1. Toy R, et al. Multimodal In Vivo Imaging Exposes the Voyage of Nanoparticles in Tumor Microcirculation. ACS Nano. 2013;7:3118–3129. - PMC - PubMed
    1. Albanese A, Tang PS, Chan WCW. The Effect of Nanoparticle Size, Shape, and Surface Chemistry on Biological Systems. Annual Review of Biomedical Engineering. 2012;14:1–16. - PubMed
    1. Jiang W, Kim BY, Rutka JT, Chan WC. Nanoparticle-mediated cellular response is size-dependent. Nat Nanotechnol. 2008;3:145–150. - PubMed

Publication types

MeSH terms

LinkOut - more resources