. 2014 Jan 1;30(1):50-60.
doi: 10.1093/bioinformatics/btt622. Epub 2013 Oct 30.

EXPANDS: expanding ploidy and allele frequency on nested subpopulations

Affiliations

EXPANDS: expanding ploidy and allele frequency on nested subpopulations

Noemi Andor et al. Bioinformatics. .

Abstract

Motivation: Several cancer types consist of multiple genetically and phenotypically distinct subpopulations. The underlying mechanism for this intra-tumoral heterogeneity can be explained by the clonal evolution model, whereby growth advantageous mutations cause the expansion of cancer cell subclones. The recurrent phenotype of many cancers may be a consequence of these coexisting subpopulations responding unequally to therapies. Methods to computationally infer tumor evolution and subpopulation diversity are emerging and they hold the promise to improve the understanding of genetic and molecular determinants of recurrence.

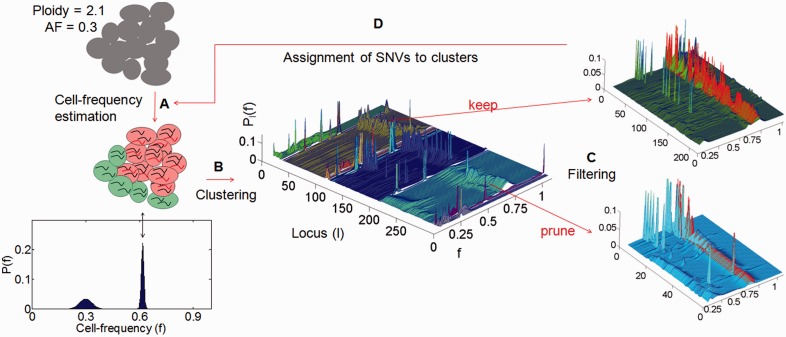
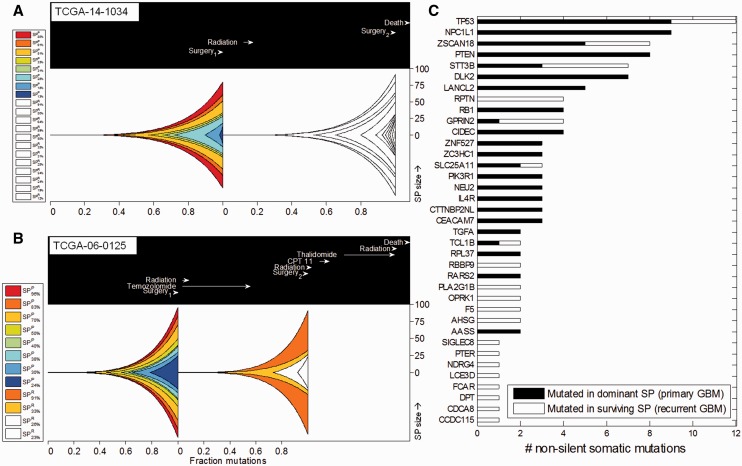
Results: To address cellular subpopulation dynamics within human tumors, we developed a bioinformatic method, EXPANDS. It estimates the proportion of cells harboring specific mutations in a tumor. By modeling cellular frequencies as probability distributions, EXPANDS predicts mutations that accumulate in a cell before its clonal expansion. We assessed the performance of EXPANDS on one whole genome sequenced breast cancer and performed SP analyses on 118 glioblastoma multiforme samples obtained from TCGA. Our results inform about the extent of subclonal diversity in primary glioblastoma, subpopulation dynamics during recurrence and provide a set of candidate genes mutated in the most well-adapted subpopulations. In summary, EXPANDS predicts tumor purity and subclonal composition from sequencing data.

Availability and implementation: EXPANDS is available for download at http://code.google.com/p/expands (matlab version--used in this manuscript) and http://cran.r-project.org/web/packages/expands (R version).


Figures

Fig. 1.
Fig. 1.
Graphical summary of the four major steps (A–D) of EXPANDS. Given a set of SNVs, EXPANDS predicts the number of clonal expansions in a tumor, the size of the resulting SPs in the tumor bulk and which SNVs accumulate in a cell before its clonal expansion. The copy number and allele frequency assigned to a SNV are measures of aggregate signals from many cells. (A) Cell frequency estimation. EXPANDS combines these two measurements to estimate what fraction of cells harbor the SNV. In this example, the observed AF (0.3) and copy number (2.1) can be explained either by a homozygous mutation, present in 30% of the cells or a heterozygous mutation, present in 60% of the cells. The cell-frequency probability P(f) is computed for each mutated locus separately. (B) Clustering. All SNVs are clustered based on their cell-frequency probability distributions. Each cluster is extended by members with similar distributions in an interval around the cluster-maxima. (C) Filtering. Clusters are pruned based on statistics within and outside the core region (interval around the cluster-maxima: highlighted in red). The blue cluster is pruned as peaks within the core region are low and do not significantly exceed peaks observed outside the core region. In contrast, the green cluster is kept as it has high and abundant peaks within and only a few peaks outside the core region. The number of remaining clusters denotes the number of predicted clonal expansions. Cell frequencies at cluster-maxima denote the predicted size of an SP in the tumor bulk. (D) Assignment of SNVs to clusters. Each SNV is assigned to one of the predicted clonal expansions, based on the cell frequency estimation computed in (A)
Fig. 2.
Fig. 2.
EXPANDS—validation experiment on simulated dataset. SP prediction accuracy is shown for variable simulation parameters. A total of 1621 clonal expansions were simulated among 350 tumors. (A and B) Receiver Operating Curve (ROC) of SP size prediction accuracy. (A) Each clonal expansion was represented by varying number of mutations formula image 
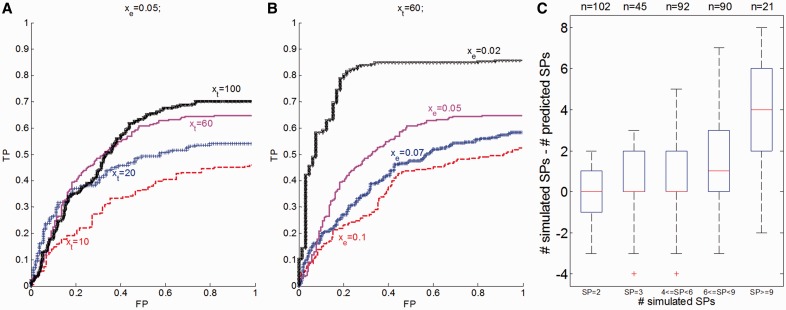
at a constant noise rate xe = 0.05. (B) A variable noise term formula image was added to the copy number and allele frequency of simulated mutations at a constant number of mutations per clonal expansion xt = 60. (C) Deviation between simulated and predicted number of SPs is shown for various numbers of simulated SPs for all 350 tumors
Fig. 3.
Fig. 3.
EXPANDS prediction accuracy depends on mutation abundance. Six consensus SPs were identified based on the allele frequency and copy number of 7175 mutations detected within a hypermutated ER-positive breast cancer genome (x-axis). The size of the consensus SPs was compared with the size of SPs predicted based on mutations found in non-overlapping regions of variable length. Mean deviation of predicted SP size from each consensus SP size (y-axis) decreases with increasing number of SNVs
Fig. 4.
Fig. 4.
Comparison of tumor purity prediction approaches. The fraction of tumor cells in each of 66 GBM samples were predicted by EXPANDS (ExP) and ABSOLUTE (ABS). The deviation between predicted tumor purity and histological purity estimates was compared between samples of low and high subclonality. Note that ABSOLUTE and EXPANDS performed similarly on samples of low to moderate subclonality. EXPANDS provided estimates of tumor purity that were closer to histological purity estimates in samples of high subclonality than ABSOLUTE (t-test: P = 9.3E-4)
Fig. 5.
Fig. 5.
Genetic changes in primary and recurrent GBM SPs. The predicted clonal composition of matched primary and recurrent GBM is shown for two patients: (A) TCGA-14-1034 and (B) TCGA-06-0125. Genetically unique clones emerge as a consequence of accumulating beneficial mutations and expand into SPs (represented by different colors). The lower x-axis shows the relative timing of clonal expansions by indicating the fraction of mutations that have accumulated in the entire tumor before the onset of each expansion. The upper box indicates timing of clinical events relative to the time from tumor initiation to first surgery (set to 237 days—the mean time between the first and the second surgery among the 10 matched patients). The y-axis indicates the percent (%) representation of each SP in the sequenced tumor bulk at the time of the first and second surgery. EXPANDS infers the presence of multiple SPs that coexist in the primary tumor at first surgery. After the first surgery, (sometimes followed by radiation, chemotherapy), the tumor recurs and EXPANDS infers the evolution of the recurrent tumor SPs. Each SP in the recurrent tumor is colored based on its predicted ancestor in the primary tumor. New SPs that were absent or undetectable in the primary GBM and emerged only on recurrence remain white. Note that the SP composition and dynamics in the two patients are different. Both patients start out with eight SPs in the primary tumors. The recurrent tumor of TCGA-14-1034 harbors 12 coexisting SPs that share little similarity to the primary SPs. In contrast the recurrent tumor of TCGA-06-0125 has only four SPs, two of which could be assigned to primary SPs. (C) Candidate driver genes mutated in fittest GBM SPs. Significantly mutated genes in selected SPs of 69 primary and 10 recurrent GBM samples as predicted by MutSig. The x-axis indicates the number of non-silent somatic mutations detected in the genes listed on the y-axis. Genes were mutated either in the dominant SPs of primary tumors (black) or in the surviving SPs of recurrent tumors (white)

References

    1. Aktipis CA, et al. Overlooking evolution: a systematic analysis of cancer relapse and therapeutic resistance research. PLoS One. 2011;6:e26100. - PMC - PubMed
    1. Anderson K, et al. Genetic variegation of clonal architecture and propagating cells in leukaemia. Nature. 2011;469:356–361. - PubMed
    1. Carter SL, et al. Absolute quantification of somatic DNA alterations in human cancer. Nat. Biotech. 2012;30:413–421. - PMC - PubMed
    1. Chen J, et al. A restricted cell population propagates glioblastoma growth after chemotherapy. Nature. 2012;488:522–526. - PMC - PubMed
    1. Fan Q-W, et al. Akt and autophagy cooperate to promote survival of drug-resistant glioma. Sci. Signal. 2010;3:ra81. - PMC - PubMed

Publication types