. 2013 Dec 20;288(51):36662-75.
doi: 10.1074/jbc.M113.466490. Epub 2013 Oct 31.

Resveratrol induces a mitochondrial complex I-dependent increase in NADH oxidation responsible for sirtuin activation in liver cells

Affiliations

Resveratrol induces a mitochondrial complex I-dependent increase in NADH oxidation responsible for sirtuin activation in liver cells

Valérie Desquiret-Dumas et al. J Biol Chem. .

Abstract

Resveratrol (RSV) has been shown to be involved in the regulation of energetic metabolism, generating increasing interest in therapeutic use. SIRT1 has been described as the main target of RSV. However, recent reports have challenged the hypothesis of its direct activation by RSV, and the signaling pathways remain elusive. Here, the effects of RSV on mitochondrial metabolism are detailed both in vivo and in vitro using murine and cellular models and isolated enzymes. We demonstrate that low RSV doses (1-5 μM) directly stimulate NADH dehydrogenases and, more specifically, mitochondrial complex I activity (EC50 ∼1 μM). In HepG2 cells, this complex I activation increases the mitochondrial NAD(+)/NADH ratio. This higher NAD(+) level initiates a SIRT3-dependent increase in the mitochondrial substrate supply pathways (i.e. the tricarboxylic acid cycle and fatty acid oxidation). This effect is also seen in liver mitochondria of RSV-fed animals (50 mg/kg/day). We conclude that the increase in NADH oxidation by complex I is a crucial event for SIRT3 activation by RSV. Our results open up new perspectives in the understanding of the RSV signaling pathway and highlight the critical importance of RSV doses used for future clinical trials.

Keywords: Complex I; Mitochondria; Mitochondrial Metabolism; NAD; NADH Dehydrogenase; Resveratrol; Sirtuins.


Figures
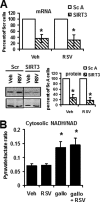
FIGURE 1.
FIGURE 1.
Control of SIRT3 silencing and of the effect of gallotannin treatment in HepG2 cells. A, control of SIRT3 knockdown by siRNA. SIRT3 knockdown was determined at the mRNA level by qPCR (SIRT3/actin ratio calculated with the −2ΔΔCt method for these two genes with similar amplification efficiency) and at the protein level by Western blot (SIRT3 (upper panel)/HSP60 (lower panel) ratio). Results are expressed as a percentage of scrambled transfected cells and represent the mean ± S.E. (error bars) of six experiments. *, significant differences (p < 0.05) compared with scrambled-transfected cells. B, effect of gallotanin versus RSV on the NAD+/NADH cytosolic ratio. The cytosolic NAD+/NADH ratio was calculated as the ratio of pyruvate/lactate concentrations measured in the HepG2 cell culture medium after 48 h of incubation with vehicle (Veh; ethanol, 1:5000), RSV (RSV; 1 μm), gallotannin (gallo; 1 mm) or gallotannin + RSV (gallo + RSV). Results are expressed as the mean ± S.E. of eight experiments.
FIGURE 2.
FIGURE 2.
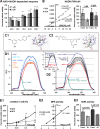
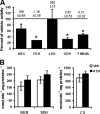
RSV in vitro inhibits NAD+ hydrogenases and activates NADH dehydrogenases. A, effect of RSV on activity of isolated ADH, FDH, LDH, GDH, and FMNdH. Activities of NAD+/NADH-dependent enzymes were measured at 30 °C for FMN and FDH, at 37 °C for GDH and LDH, and at 25 °C for ADH on purified enzymes incubated with vehicle (ethanol, 1:5000) or RSV at 1 or 5 μm. Results are expressed as a percentage of vehicle activity. Absolute values were 199 ± 5.69, 1.18 ± 0.06, 260 ± 15, 2.97 ± 0.53, and 0.31 ± 0.02 μmol·min−1·mg of protein−1 for ADH, FDH, LDH, GDH, and FMNdH, respectively. Data represent the mean ± S.E. (error bars) (n = 5). *, significant differences (p < 0.05) compared with vehicle. B, detailed effects of RSV on isolated FMNdH activity. FMNdH activity was monitored on purified enzyme after the addition of vehicle (Veh; ethanol, 1:1000) or RSV. Left, Lineweaver-Burk plot showing the effect of RSV on enzymatic activity in presence of different NADH, H+ (50, 100, or 200 μm), and RSV (0 and 5 μm) concentrations. Vmax values are expressed in nmol·min−1·mg of protein−1, and Km is expressed in mm NADH. Right, effect of RSV on enzymatic activity in the presence of different RSV analogs (trans-RSV or triacetyl-RSV; 0, 1, or 5 μm). Results shown are representative of n = 4 independent preparations. C, in silico prediction of the binding of trans-RSV (C1) or triacetyl-RSV (C2) to the FMNdH in the presence of NAD+ using FlexX software. D, UV-visible adsorption spectra of RSV. D1, adsorption spectra of trans-RSV and triacetyl-RSV in the absence or presence of NAD+, FMNdH, or pyruvate kinase (5 μg·ml−1). D2, adsorption spectra of trans-RSV in the absence or presence of NAD+ and various concentrations of FMNdH (1, 2, 5, 10, and 20 μg·ml−1) or in the absence or presence of various concentrations of BSA (top inset; 50, 250, 375, 500, and 750 μg·ml−1). E, effect of RSV on complex I activity. E1, NUR (rotenone-sensitive) and NFR activities of complex I were measured on preparation of isolated, disrupted liver mitochondria after incubation with increasing RSV concentrations (0.05–5 μm; left). Absolute values for NUR and NFR activities were 193 ± 30 and 573 ± 81 nmol·min−1·mg of protein−1, respectively, for vehicle conditions and 384 ± 19 and 3540 ± 791 nmol·min−1·mg of protein−1, respectively, for RSV 5 μm. E2, dose-response plot normalized to the maximal stimulation of NFR activity for EC50 determination. E3, effect of either trans-RSV or triacetyl-RSV (0, 1, or 5 μm) on NUR activity. Data represented the mean ± S.E. (n = 5). *, significant differences (p < 0.05) compared with vehicle.
FIGURE 3.
FIGURE 3.
RSV stimulates NADH dehydrogenase activities in HepG2 cells and increases mitochondrial NAD+ content. A, effect of different RSV doses on two NADH dehydrogenases (NUR and LDH) activities on HepG2 cells. HepG2 cells were incubated for 48 h with vehicle (Veh; ethanol, 1:5000) or RSV (1 or 5 μm). Maximal activities of NUR and LDH were measured on cell extracts. Results are expressed as the mean ± S.E. (error bars) (n = 4). *, significant differences (p < 0.05) compared with vehicle-treated cells. B, effect of RSV on NADH oxidation in isolated mitochondria. Respiration rates were measured on isolated mitochondria of RSV (48 h, 1 μm)-treated or vehicle (Veh; ethanol, 1:5000)-treated HepG2 cells. MP, respiration rate with complex I substrates (i.e. 5 mm malate + 2.5 mm pyruvate; NAD+ addition of 0.5 mm NAD+; cyt c, the addition of 8 μm cytochrome c; MPS, complex I and II substrates (i.e. malate, pyruvate, and 10 mm succinate); SR, the addition of 5 μm rotenone. Results are expressed as the mean ± S.E. (n = 6). *, significant differences (p < 0.05) compared with vehicle-treated cells. C, effect of RSV treatment on cellular NADH and NAD+ levels in HepG2 cells. The cellular free NADH and NAD+ levels were determined on HepG2 cells incubated during 48 h with vehicle (Veh; ethanol, 1:5000) or RSV (1 μm). Results are expressed as the mean ± S.E. of eight experiments. D, effect of RSV treatment on NADH autofluorescence on HepG2 cells. Left, NADH autofluorescence was measured by fluorescent microscopy on HepG2 cells incubated with vehicle (Veh; ethanol, 1:5000) or RSV (1 μm, 4 h). In positive control, rotenone (10 nm) was added 15 min before RSV treatment. Data are shown as a representative picture of n = 3. Right, NADH redox index measured in vehicle- and RSV-treated cells by recording the NADH autofluorescence in basal conditions, following the addition of an uncoupler (m-Cl-CCP, 10 μm) and respiration inhibitors (KCN (1 mm) and rotenone (5 μm)) in both vehicle- and RSV-treated cells. The NADH redox index is then calculated by expressing the basal autofluorescence as a ratio of this range and as the mean ± S.E. of five experiments. *, significant differences (p < 0.05) compared with vehicle-treated cells. E, effect of RSV on cytosolic NAD+/NADH ratio. The cytosolic NAD+/NADH ratio was calculated as the ratio of pyruvate/lactate concentrations measured in culture medium of vehicle (Veh; ethanol, 1:5000)-treated or RSV (RSV, 1 μm; 48 h)-treated cells. *, significant differences (p < 0.05) compared with vehicle-treated cells.
FIGURE 4.
FIGURE 4.
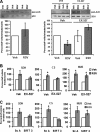
SIRT3 is involved in the effects of RSV on SDH and CS but not NUR activities. A, effect of RSV on acetylation status of sirtuin target proteins. Left, p53 was immunoprecipitated from HepG2 cells incubated with RSV (48 h, 1 μm). Right, SDH was immunoprecipitated from HepG2 cells incubated with RSV (48 h, 1 μm) and/or with EX-527 (100 μm). The graph represents the mean of the acetyl-lysine/SDH protein ratio of n = 11 experiments. *, significant differences (p < 0.05) compared with vehicle-treated cells. B, effect of sirtuin inhibition on RSV-induced stimulation of SDH, CS, and NUR activities. HepG2 cells were incubated with EX-527 (100 μm) or without (vehicle, DMSO (1:1000)) before the addition of RSV (1 μm) or vehicle (Veh; ethanol (1:5000)). Enzymatic activities of SDH, CS, and NUR were measured. Results are expressed as a percentage of vehicle-treated cells and represent the mean ± S.E. (error bars) (n = 4). *, significant differences (p < 0.05) compared with vehicle-treated cells. C, effect of SIRT3 knockdown on RSV-induced stimulation of SDH, CS, and NUR activities. HepG2 cells were transfected with scrambled or SIRT3 siRNAs and incubated with vehicle (ethanol, 1:5000) or RSV (1 μm) for 48 h. Data represent the mean ± S.E. of n = 9 SDH and CS measurements and n = 6 NUR measurements. *, significant differences (p < 0.05) compared with vehicle-treated cells.
FIGURE 5.
FIGURE 5.
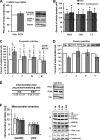
RSV treatment activates mitochondrial biogenesis pathways neither in HepG2 cells (1 μm, 48 h) nor in mice liver (50 mg·kg·day). A, Western blot quantification phospho-AMPK/total AMPK ratio in HepG2 cells treated for 48 h with RSV (1 μm). The blot on the left is a representative blot of eight experiments. B, effect of AMPK inhibition on RSV-induced activation of NUR, SDH, and CS activities. HepG2 cells were first treated with vehicle (ethanol, 1:5000) or compound C (10 μm), an inhibitor of AMPK activity, and then incubated with 1 μm RSV or vehicle (Veh; ethanol, 1:5000). Enzymatic activities of NADH ubiquinone reductase (NUR), succinate dehydrogenase (SDH), and citrate synthase (CS) were then measured on cell lysates. Results are expressed as a percentage of vehicle-matched treated cells and as the mean ± S.E. of four experiments. The dotted line placed at 100% represents the vehicle value. C–E, mitochondrial biogenesis in HepG2 cells treated for 48 h with RSV (1 μm). C, maximal activity of the complexes I, II, III, and IV (n = 8 ± S.E. (error bars)) on HepG2 cells after RSV treatment. Data represent the mean ± S.E. of four experiments. Results are expressed as a percentage of vehicle-treated cells and represent the mean ± S.E. (n = 4). The actual values of complex activities are shown on the top of the corresponding graph bar and are expressed in nmol·min−1·mg protein−1. *, significant differences (p < 0.05) compared with vehicle-treated cells. D, Western blot analysis of one subunit for each mitochondrial respiratory chain complex after 48 h of RSV treatment: NDUFB8 (complex I), SDHB (complex II), COX2 (complex IV), and Vα (Complex V). Shown are representative blots of four experiments. E, left, mitochondrial extraction yield in HepG2 cells treated for 48 h with RSV (1 μm). The results presented are the ratio of mitochondrial versus cellular protein amount. Data represent the mean ± S.E. of four experiments. Right, Western blot analysis of one PGC1α and TFAM expression after 48 h of RSV treatment Representative blots of four experiments. F, mitochondrial biogenesis in liver mitochondria of controls and RSV-treated mice. Left, mitochondrial protein amount was determined in young (Y) and old (O) mice fed on control (Ctl) and RSV-enriched (RSV) diets and expressed as a quantity of mitochondrial proteins (quantity) and normalized to the tissue weight (yield). n = 6 for each group; data represent the mean ± S.E. (right) The protein expression of respiratory chain complex subunits was evaluated by Western blotting using antibodies directed against one subunit of each complex. Nuclear co-activator (PGC1a), nuclear transcription factor NRF1, and TFAM protein expression was assessed by Western blot analysis. Loading was controlled by detection of VDAC (mitochondrial fraction; M) and tubulin (cytoplasmic fraction; C) proteins. Shown is a representative blot of four experiments.
FIGURE 6.
FIGURE 6.
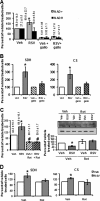
The mitochondrial NAD+ increase induced by RSV is responsible for SDH and CS activation. A, effect of gallotannin pretreatment on RSV-induced increase in the cellular level of NAD+. Cellular NADH and NAD+ levels were determined on HepG2 cells treated for 4 h with vehicle (Veh; ethanol, 1:5000), RSV (1 μm), or gallotannin (Gallo; 1 mm). Results are expressed as a percentage of vehicle-treated cells and represent the mean ± S.E. (error bars) of eight experiments. The actual values are shown on the top of the corresponding graph bar and are expressed in pmol·mg of protein−1. *, significant differences (p < 0.05) compared with vehicle-treated cells. B, effect of NAD+ increase on SDH and CS activities. HepG2 cells were incubated with RSV (1 μm) or gallotannin (1 mm) + RSV (1 μm). Enzymatic activities of SDH and CS were measured. Results are expressed as a percentage of vehicle-treated cells and represent as the mean ± S.E. of four experiments. C, effect of rotenone pretreatment on RSV-induced increase in cellular NAD+ level and SDH acetylation status. Left, NAD+ content was determined in HepG2 cells preincubated with rotenone (10 nm) before RSV (1 μm) or vehicle (Veh; ethanol, 1:5000) treatment. Data represent the mean ± S.E. of four experiments and are expressed as a percentage of RSV-treated cells. The actual values of NAD+ content are shown on the top of the corresponding graph bar and are expressed in pmol·mg proteins−1. *, significant differences (p < 0.05) compared with vehicle; #, significant differences (p < 0.05) between vehicle and rotenone-treated cells. Right, SDH was immunoprecipitated from HepG2 cells incubated with RSV (48 h, 1 μm) and/or with rotenone (10 nm). The graph represents the mean of the acetyl-lysine (upper panel)/SDH protein (lower panel) ratio of n = 6 experiments. *, significant differences (p < 0.05) compared with vehicle-treated cells. D, effect of modulation of NAD+ concentration on SDH and CS activities. Enzymatic activities of SDH and CS were measured on HepG2 cells preincubated with rotenone (Rot; 10 nm) or compared with vehicle (V) before RSV treatment (1 μm). Results are expressed as a percentage of vehicle-treated cells and represent the mean ± S.E. of four experiments. *, significant differences (p < 0.05) compared with vehicle.
FIGURE 7.
FIGURE 7.
High RSV dose (50 μm) inhibits dehydrogenase activities and does not increase the TCA cycle enzymatic activities. A, effect of high RSV dose on activity of isolated dehydrogenases: ADH, FDH, LDH, GDH, and FMN. Actual values of enzyme activities measured at 30 °C for FMNdH and FDH, at 37 °C for GDH and LDH, and at 25 °C for ADH are indicated at the top of the corresponding bar graph (data are expressed in μmol·min−1·mg of proteins−1). B, effect of high RSV dose on TCA enzymatic activities. Enzymatic activities of NUR, SDH, and CS were measured on HepG2 cells (RSV, 5 or 50 μm, 48 h). Results are expressed as a percentage of vehicle-treated cells and represent the mean ± S.E. (error bars) (n = 4). *, significant differences (p < 0.05) compared with vehicle.
FIGURE 8.
FIGURE 8.
RSV induces an increase in complex I activity in liver. A and B, complex I activity and substrate oxidation by complex I measured on isolated liver mitochondria of young versus old mice. A, enzymatic activities of complex I (NUR). B, oxygraphic measurement of maximal, phosphorylating, complex I-linked respiration using malate and pyruvate (+ADP) as substrates. +, significant differences (p < 0.05) compared with old mice. C and D, effect of RSV on complex I properties of mice liver mitochondria. C, effect of RSV on NUR activity on control mitochondria. Ctr, isolated liver mitochondria of control young mice; Cx + RSV, activity of complex I measured on preparation of isolated, disrupted liver mitochondria after 1 μm RSV addition; Mito + RSV, activity of complex I measured on isolated intact mitochondria incubated (30 min) with 1 μm RSV; Mice + RSV, activity of complex I measured on isolated mitochondria from young mice with RSV diet (1.3 μmol/kg in liver). D, effect of RSV diet on complex I properties in liver mitochondria of young and old mice. Left, NUR activity; right, oxygraphic measurement of maximal, phosphorylating, complex I-linked respiration using malate and pyruvate (+ADP) as substrates. Data represent the mean ± S.E. (error bars) for each group. *, significant differences (p < 0.05) compared with control diet.
FIGURE 9.
FIGURE 9.
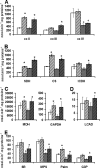
RSV induces an increase in the substrate supply in liver. A, maximal activities of respiratory chain complexes in controls and RSV-fed mice. Activity of complexes II (succinate ubiquinone reductase), III (ubuiquinol cytochrome c reductase), and IV (cytochrome c oxidase) were measured on liver mitochondria of control (Ctl) and RSV-fed (RSV) young and old mice. B, maximal activities of enzymes involved in respiratory chain substrate supply pathways. Activity of Krebs cycle (SDH, CS, and isocitrate dehydrogenase (ICDH)), enzymes were measured on liver mitochondria of control (Ctl) and RSV-fed (RSV) mice. C, maximal activities of enzymes involved in GAPDH shuttle. Activities of malate dehydrogenase (MDH) and GAPDH were measured on liver mitochondria of control (Ctl) and RSV-fed (RSV) mice. D, maximal activities of enzyme involved in fatty acid oxidation. Long-chain acyl-CoA dehydrogenase (LCAD) activity was measured on liver mitochondria of control (Ctl) and RSV-fed (RSV) mice. E, maximal coupled respiration in liver mitochondria. Coupled respiration measured on isolated liver mitochondria using complex I, II, or III or FAO substrates. White bars, control diet mice (Y); gray bars, RSV-fed groups. Shadings are used for old mice. Data represent the mean ± S.E. (error bars) of five animals for each group. +, significant differences (p < 0.05) compared with old mice; *, significant differences (p < 0.05) compared with control diet.
FIGURE 10.
FIGURE 10.
Recapitulative scheme of the suggested resveratrol signaling pathway on mitochondrial metabolism. RSV directly stimulates complex I activity (1), thus turning on the mitochondrial NAD+/NADH balance toward increasing NAD+ concentration (2). This favors sirtuin activation (3), which finally enhances substrates supply to respiratory chain by both tricarboxylic acid cycle and fatty acid oxidation (4). This increase in substrate supplies to the respiratory chain leads to an increase in respiration rates (5) after resveratrol treatment.

Similar articles

Cited by

References

    1. Richard T., Pawlus A. D., Iglesias M. L., Pedrot E., Waffo-Teguo P., Merillon J. M., Monti J. P. (2001) Neuroprotective properties of resveratrol and derivatives Ann. N.Y. Acad. Sci. 1215, 103–108 - PubMed
    1. Petrovski G., Gurusamy N., Das D. K. (2011) Resveratrol in cardiovascular health and disease Ann. N.Y. Acad. Sci. 1215, 22–33 - PubMed
    1. Baur J. A., Pearson K. J., Price N. L., Jamieson H. A., Lerin C., Kalra A., Prabhu V. V., Allard J. S., Lopez-Lluch G., Lewis K., Pistell P. J., Poosala S., Becker K. G., Boss O., Gwinn D., Wang M., Ramaswamy S., Fishbein K. W., Spencer R. G., Lakatta E. G., Le Couteur D., Shaw R. J., Navas P., Puigserver P., Ingram D. K., de Cabo R., Sinclair D. A. (2006) Resveratrol improves health and survival of mice on a high-calorie diet. Nature 444, 337–342 - PMC - PubMed
    1. Lagouge M., Argmann C., Gerhart-Hines Z., Meziane H., Lerin C., Daussin F., Messadeq N., Milne J., Lambert P., Elliott P., Geny B., Laakso M., Puigserver P., Auwerx J. (2006) Resveratrol improves mitochondrial function and protects against metabolic disease by activating SIRT1 and PGC-1α. Cell 127, 1109–1122 - PubMed
    1. Mercader J., Palou A., Bonet M. L. (2011) Resveratrol enhances fatty acid oxidation capacity and reduces resistin and retinol-binding protein 4 expression in white adipocytes. J. Nutr. Biochem. 22, 828–834 - PubMed

Publication types