. 2014 Jan;6(1):66-79.
doi: 10.1002/emmm.201303411.

Sox2 promotes tamoxifen resistance in breast cancer cells

Sox2 promotes tamoxifen resistance in breast cancer cells

Marco Piva et al. EMBO Mol Med. 2014 Jan.

Abstract

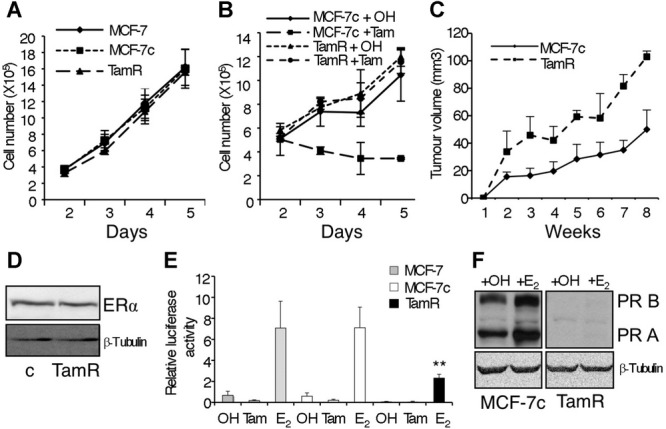
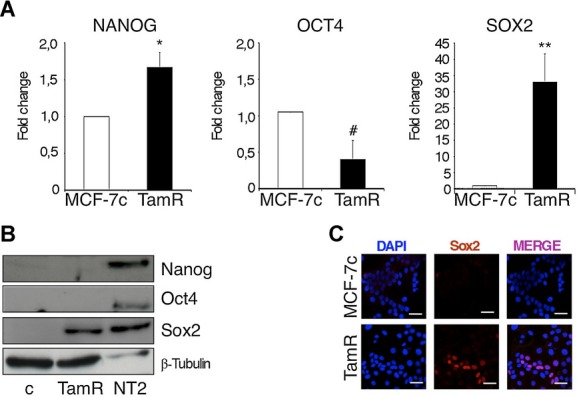
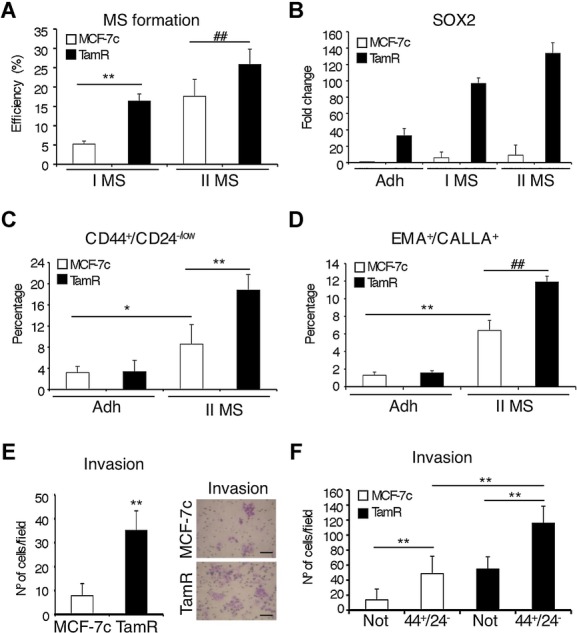
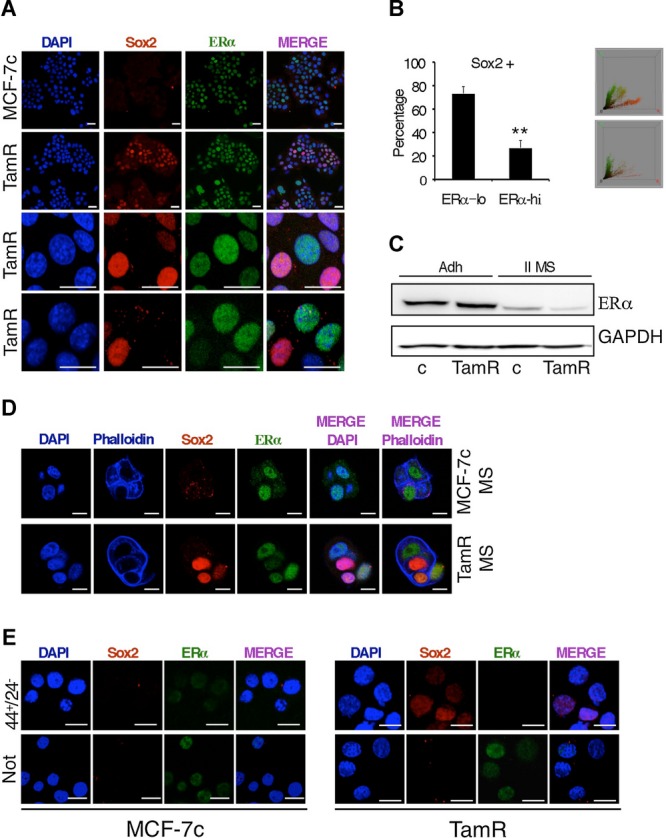
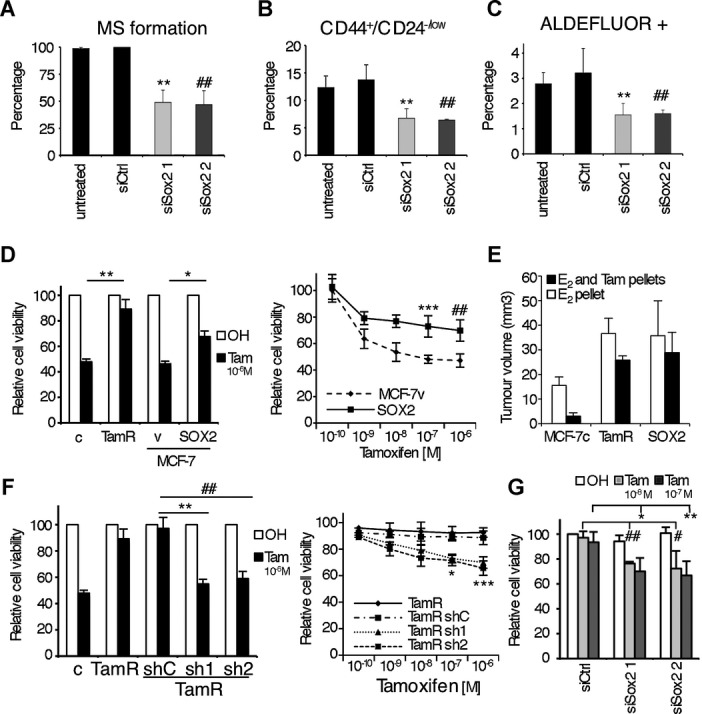
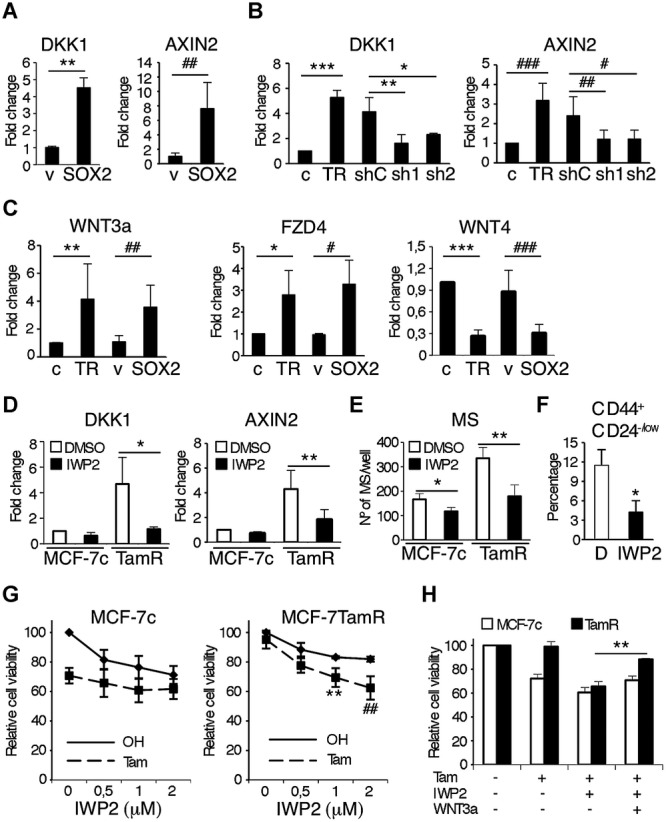
Development of resistance to therapy continues to be a serious clinical problem in breast cancer management. Cancer stem/progenitor cells have been shown to play roles in resistance to chemo‐ and radiotherapy. Here, we examined their role in the development of resistance to the oestrogen receptor antagonist tamoxifen. Tamoxifen‐resistant cells were enriched for stem/progenitors and expressed high levels of the stem cell marker Sox2. Silencing of the SOX2 gene reduced the size of the stem/progenitor cell population and restored sensitivity to tamoxifen. Conversely, ectopic expression of Sox2 reduced tamoxifen sensitivity in vitro and in vivo. Gene expression profiling revealed activation of the Wnt signalling pathway in Sox2‐expressing cells, and inhibition of Wnt signalling sensitized resistant cells to tamoxifen. Examination of patient tumours indicated that Sox2 levels are higher in patients after endocrine therapy failure, and also in the primary tumours of these patients, compared to those of responders. Together, these results suggest that development of tamoxifen resistance is driven by Sox2‐dependent activation of Wnt signalling in cancer stem/progenitor cells.


Figures

Figure 1
Figure 1
Characterization of MCF-7TamR cells. A  Proliferation assay of MCF-7 (wt), MCF-7c (control) and MCF-7TamR (tamoxifen resistant) cells (n = 3). B  Proliferation assay of MCF-7c and MCF-7TamR cells treated with ethanol (OH) or 5 × 10−7 M tamoxifen (Tam) (n = 3). C  Tumour growth curve of MCF-7c and MCF-7TamR cells implanted s.c. in athymic mice in the presence of an exogenous slow release, oestrogen implant (n = 5 mice/group). D  Western blot analysis of ERα expression in MCF-7c (c) and MCF-7TamR cells. E  MCF-7 (grey bars), MCF-7c (white bars) and MCF-7TamR (black bars) cells were transfected with a reporter plasmid containing three copies of a consensus ERE driving a luciferase reporter in the presence of the carrier ethanol (OH) or 5 × 10−7 M tamoxifen (Tam) or 10−8 M oestrogen (E2). In all transfections, β-galactosidase activity was used to control for transfection efficiency (n = 5) **p = 0.007 by t-test. F  Progesterone receptor expression in control (MCF-7c) and resistant (TamR) cells by Western blot analysis.
Figure 2
Figure 2
MCF-7TamR cells express high levels of SOX2. A  Transcript levels of NANOG, OCT4 and SOX2 in adherent MCF-7c and MCF-7TamR (TamR) cells were quantified by real-time PCR and presented as fold induction with MCF-7c value set as 1 (n = 5) *p = 0.03, #p = 0.023, **p = 0.004 by t-test. B  Immunoblots of Nanog, Oct4, Sox2 and β-tubulin (loading control) in MCF-7c and MCF-7TamR cells. NTera2/D1 (NT2) cells were used as positive control for the expression of the stem cell markers. C  Immunofluorescence analysis of Sox2 expression in MCF7c and MCF-7TamR cells. Scale bar = 40 μm.
Figure 3
Figure 3
MCF-7TamR cells contain a higher proportion of stem cells than parental cells. A  Primary (I MS) and secondary (II MS) mammosphere efficiency formation from MCF-7c and MCF-7TamR cells represented as the percentage of mammospheres formed (n = 5) **p = 0.003, ##p = 0.008 by t-test. B  SOX2 mRNA expression levels in MCF-7c and MCF-7TamR cells grown in adherent (Adh) or mammosphere (I MS and II MS) cultures were quantified by real-time PCR (n = 3). C, D  Flow cytometry analysis of (C) CD44+/CD24−/low (n = 5, *p = 0.028 **p = 0.0045 by t-test) and (D) EMA+/CALLA+ (n = 3, **p = 0.0021, ##p = 0.0028 by t-test) stem cell populations in MCF-7c and MCF-7TamR cells cultured as adherent cells (Adh) or as secondary mammospheres (II MS), represented as the percentage of cells with the indicated phenotype within the total population. E  Matrigel invasion assay was performed using adherent MCF-7c and MCF-7TamR cells. The photographs on the right show a representative field (n = 3) **p = 0.001 by t-test. Scale bar = 100 μm. F  Matrigel invasion assay was performed using secondary mammospheres from MCF-7c and MCF-7TamR cells FACS-sorted to isolate CD44+CD24−/low (44+24) stem cells and the remaining cell population lacking CD44+z24−/low cells (Not) (n = 3) **p < 0.001 by t-test.
Figure 4
Figure 4
Inverse association between ER and Sox2 expression in MCF-7TamR cells. A  Coexpression of SOX2 and ER was visualized by immunofluorescence in MCF-7c and MCF-7TamR cells grown as adherent cells (scale bar = 40 μm) and, B  as secondary mammospheres at day 4 (Scale bar = 20 μm). C  Left, percentage of adherent MCF-7TamR cells that were Sox2-positive and that expressed low (lo) or high (hi) ER levels (n = 3) **p = 0.0011 by t-test. Right, 2 representative plots obtained with ImageJ 3d colour inspector analysis, in green and in red, ER and Sox2 positivity, respectively. D  Western blot analysis of ER expression levels in MCF-7c and MCF-7TamR cells grown as adherent cells (Adh) or as secondary mammospheres (II MS). GAPDH was used as a loading control. E  Immunofluorescence analysis of Sox2 and ER expression in FACS-sorted CD44+CD24−/low (44+24) stem cells and the rest of the cell population lacking CD44+CD24−/low cells (Not). Scale bar = 30 μm.
Figure 5
Figure 5
Alteration of Sox2 expression levels affects stem cell properties. A  Mammosphere formation assay of MCF-7TamR cells transfected with siRNA. Values obtained with scramble siRNA are set as 100% (n = 3) **p = 0.01, ##p = 0.009 by t-test. B  CD44+CD24−/low stem cell population analysis of primary mammospheres (n = 3) **p = 0.011, ##p = 0.01 by t-test and C  ALDEFLUOR assays in adherent cells, were all performed using MCF-7TamR cells transfected with 2 different Sox2 siRNA sequences (siSox2 1 and 2) as well as a control siRNA sequence (siCtrl) (n = 3) **p = 0.002, ##p = 0.009 by t-test. D  Viability analysis by crystal violet (left) of MCF-7c (c), MCF-7TamR (TamR) cells and MCF-7 cells stably overexpressing Sox2 (Sox2) and control MCF-7v (v) cells (n = 5) **p = 0.008, *p = 0.02 by t-test and (right) MTT assays of MCF-7SOX2 (SOX2) and control MCF-7v (v) cells growing in presence of increasing concentrations of tamoxifen (from 10−10 M to 10−6 M) (n = 5) ***p = 0.008, ##p = 0.007 by t-test. E  Tumour size 3 weeks after s.c. implantation of MCF-7c, MCF-7TamR and MCF-7SOX2 cells in athymic female mice in the presence of an exogenous slow oestrogen supplement and with or without a tamoxifen pellet (n = 5 mice/group). F  Viability analysis by (left) crystal violet (n = 5, **p = 0.003, ##p = 0.02 by t-test) and (right) MTT assays (n = 5, *p = 0.004, ***p = 0.0008 by t-test) of MCF-7c (c), MCF-7TamR (TamR) and MCF-7TamR cells stably transfected with shRNA against Sox2 (sh1 and sh2) and control (shC), growing in the presence of vehicle (ethanol, OH) or tamoxifen. G  Viability analysis by crystal violet and of BT474 cells transfected with a control siRNA sequence (siCtrl) and two different Sox2 siRNA sequences (siSox2 1 and 2) growing in the presence of vehicle (ethanol, OH) or tamoxifen at different concentrations (10−8 M, ##p = 0.009, #p = 0.017, 10−7 M, *p = 0.044, **p = 0.002 by t-test, as indicated, n = 3).
Figure 6
Figure 6
Sox2 expression increases during the development of tamoxifen resistance in breast cancer patients. A  Allred score for Sox2 (A) and PR staining (B). Patients with responder primary tumours (n = 33), namely those that responded to tamoxifen treatment (Resp.); patients with non-responder primary tumours (n = 22) (Non-Resp.) and their recurrent tumours after therapy failure (Recur.). p-values were calculated by Bonferroni multiple comparable test. C–E  Examples of Sox2 staining in (C) a tumour responsive to treatment, (D) a primary tumour not responsive to therapy and (E) a recurrent lesion from the matched primary tumour in (D). F  Correlation between Sox2 expression and recurrence in ER-positive tamoxifen treated breast cancer patients. Box plot from the study indicated (Chanrion et al, 2008) is shown. The y-axis shows normalized expression units. Data are median centered and the 25th–75th percentiles are indicated by the closed box. The numbers of breast carcinoma samples present are shown in parentheses and GEO accession numbers are indicated. Resp and Non Resp. tumours as above. G  The association between Sox2 expression levels and disease free survival (top) and overall survival (bottom) was evaluated by Kaplan–Meier analysis. p-values were calculated by Cox proportional hazards regression analyses. The Sox2 low group was defined by expressing lower Sox2 levels than the median of all patients in the study, and the rest of the patients belonged to the Sox2 high group.
Figure 7
Figure 7
Sox2 overexpression leads to the activation of Wnt signalling. A  DKK1 and AXIN2 mRNA expression levels in MCF-7v (v) and MCF-7SOX2 cells grown in adherent conditions (n = 5) **p = 0.002, ##p = 0.002 by t-test. B  DKK1 (***p = 0.0001, **p = 0.009, *p = 0.042 by t-test) and AXIN2 (###p = 0.009,##p = 0.043, #p = 0.029 by t-test) mRNA expression levels in MCF-7c (c) and MCF7TamR (TR) cells and MCF-7TamR cells stably transfected with 2 different Sox2 shRNA sequences (sh1 and sh2) as well as a control shRNA sequence (shC) grown in adherent conditions (n = 5). C  Wnt-3a (**p = 0.008, ##p = 0.0056 by t-test), FZD4 (*p = 0.021, #p = 0.016 by t-test) and WNT4 (***p = 0.0001, ###p = 0.0015 by t-test) mRNA expression levels in MCF-7c (c), MCF7TamR (TR), MCF-7v (v) and MCF-7SOX2 cells grown in adherent conditions (n = 5). D  DKK1 and AXIN2 mRNA expression levels in MCF-7c (c) and MCF7TamR (TR) cells treated for 48 h with 1 μM of IWP-2 or the vehicle (DMSO) (n = 3) *p = 0.012, **p = 0.017 by t-test. E  Mammosphere formation assay from MCF-7c and MCF-7TamR (TamR) cells growing in presence of 1 μM of IWP-2 or the vehicle (DMSO) (n = 3) *p = 0.036, **p = 0.002 by t-test. F  Flow cytometry analysis of the CD44+/CD24−/low stem cell population in MCF-7TamR cells grown as mammospheres in presence of 1 μM of IWP-2 or the vehicle (D) (n = 3) *p = 0.045 by t-test. G  Cell viability analysis by MTT assay of MCF-7c (left) and MCF-7TamR (right) cells growing in the presence of increasing concentrations of IWP-2 (from 0.5 μM to 2 μM) and in presence or absence of 10−7 M tamoxifen (n = 5) **p = 0.002, ##p = 0.0011 by t-test. H  Cell viability analysis by MTT assay of MCF-7c and MCF-7TamR cells growing in the presence or absence of 10−7 M tamoxifen, 1 μM IWP-2 and 100 ng/ml recombinant Wnt-3a as indicated (n = 3) **p = 0.001.

References

    1. Al-Hajj M, Wicha MS, Benito-Hernandez A, Morrison SJ, Clarke MF. Prospective identification of tumorigenic breast cancer cells. Proc Natl Acad Sci USA. 2003;100:3983–3988. - PMC - PubMed
    1. Ali S, Coombes RC. Endocrine-responsive breast cancer and strategies for combating resistance. Nat Rev Cancer. 2002;2:101–112. - PubMed
    1. Ayyanan A, Civenni G, Ciarloni L, Morel C, Mueller N, Lefort K, Mandinova A, Raffoul W, Fiche M, Dotto GP, et al. Increased Wnt signaling triggers oncogenic conversion of human breast epithelial cells by a Notch-dependent mechanism. Proc Natl Acad Sci USA. 2006;103:3799–3804. - PMC - PubMed
    1. Ben-Porath I, Thomson MW, Carey VJ, Ge R, Bell GW, Regev A, Weinberg RA. An embryonic stem cell-like gene expression signature in poorly differentiated aggressive human tumors. Nat Genet. 2008;40:499–507. - PMC - PubMed
    1. Chanrion M, Negre V, Fontaine H, Salvetat N, Bibeau F, Mac Grogan G, Mauriac L, Katsaros D, Molina F, Theillet C, et al. A gene expression signature that can predict the recurrence of tamoxifen-treated primary breast cancer. Clin Cancer Res. 2008;14:1744–1752. - PMC - PubMed

Publication types

MeSH terms