Review
. 2013 Nov 1;342(6158):580-4.
doi: 10.1126/science.1238409.

Functional interactions as big data in the human brain

Affiliations
Review

Functional interactions as big data in the human brain

Nicholas B Turk-Browne. Science. .

Abstract

Noninvasive studies of human brain function hold great potential to unlock mysteries of the human mind. The complexity of data generated by such studies, however, has prompted various simplifying assumptions during analysis. Although this has enabled considerable progress, our current understanding is partly contingent upon these assumptions. An emerging approach embraces the complexity, accounting for the fact that neural representations are widely distributed, neural processes involve interactions between regions, interactions vary by cognitive state, and the space of interactions is massive. Because what you see depends on how you look, such unbiased approaches provide the greatest flexibility for discovery.


Figures

Fig. 1
Fig. 1. Standard types of fMRI analysis
(A) Univariate activation refers to the average amplitude of BOLD activity evoked by events of an experimental condition. (B) Multivariate classifiers are trained on patterns of activation across voxels to decode distributed representations for specific events. (C) Resting connectivity is the temporal correlation of one or more seed regions with the remainder of the brain during rest. (D) Task-based connectivity examines how these correlations differ by cognitive state. (E) Full connectivity considers all pairwise correlations in the brain, most commonly at rest.
Fig. 2
Fig. 2. Attentional modulation of functional connectivity
(A) The guided activation theory of cognitive control posits that prefrontal cortex (PFC) sends feedback to posterior cortex to switch connectivity between areas and establish task-relevant pathways (22). (B) Such pathways exist in the visual cortex of nonhuman primates: V4 shows enhanced coherence with the area of V1 containing receptive fields for the attended target (25). (C) This mechanism also supports category-based selection in human visual cortex: V4 shows stronger background connectivity with the fusiform face area (FFA) when faces are attended and with the parahippocampal place area (PPA) when scenes are attended (24). Figures adapted with permission.
Fig. 3
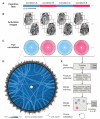
Fig. 3. Full correlation matrix analysis pipeline
(A) An fMRI data set is divided into time windows, which are labeled with an experimental condition. (B) Each window contains multiple time points, and each time point corresponds to a 3-D brain image. (C) The time course of BOLD activity in every voxel is correlated with every other voxel to produce a full correlation matrix for each window. (D) An example matrix from a 36-s block of fMRI data is depicted with 39,038 voxels arranged in a circle and 0.01% of correlations of >0.3 plotted as links (visualization created with Circos, www.circos.ca). The luminance and thickness of links reflects the absolute correlation in four graded steps. The surrounding histogram is a count of the number of above-threshold links per voxel. (E) These matrices can be submitted as examples to MVPA, with each voxel pair as an input dimension. Data-driven feature selection helps discover meaningful relationships for classification. For more information: www.princeton.edu/fcma.
Fig. 4
Fig. 4. Pattern analysis of correlations
(A) fMRI data were collected during four cognitive states. (B) The correlation matrix of 90 functional regions during each state. Each cell reflects the correlation between two regions, thresholded on the basis of the reliability of the correlation across participants. Pairs that were reliable in more than one state were excluded, generating a task-specific template. Grid lines demarcate anatomical regions, each containing a variable number of functional regions. (C) Using these templates, correlation matrices from a second group of participants could be decoded into cognitive states with high accuracy. Figures adapted with permission from (42).

Similar articles

Cited by

References

    1. Kanwisher N. Proc. Natl. Acad. Sci. U.S.A. 2010;107:11163–11170. - PMC - PubMed
    1. Huth AG, Nishimoto S, Vu AT, Gallant JL. Neuron. 2012;76:1210–1224. - PMC - PubMed
    1. Norman KA, Polyn SM, Detre GJ, Haxby JV. Trends Cogn. Sci. 2006;10:424–430. - PubMed
    1. Haxby JV, et al. Science. 2001;293:2425–2430. - PubMed
    1. Kok P, Jehee JFM, de Lange FP. Neuron. 2012;75:265–270. - PubMed

Publication types