. 2013 Mar;7(1):10.1016/j.artres.2012.12.002.
doi: 10.1016/j.artres.2012.12.002.

Ventricular-arterial coupling: Invasive and non-invasive assessment

Affiliations

Ventricular-arterial coupling: Invasive and non-invasive assessment

Julio A Chirinos. Artery Res. 2013 Mar.

Abstract

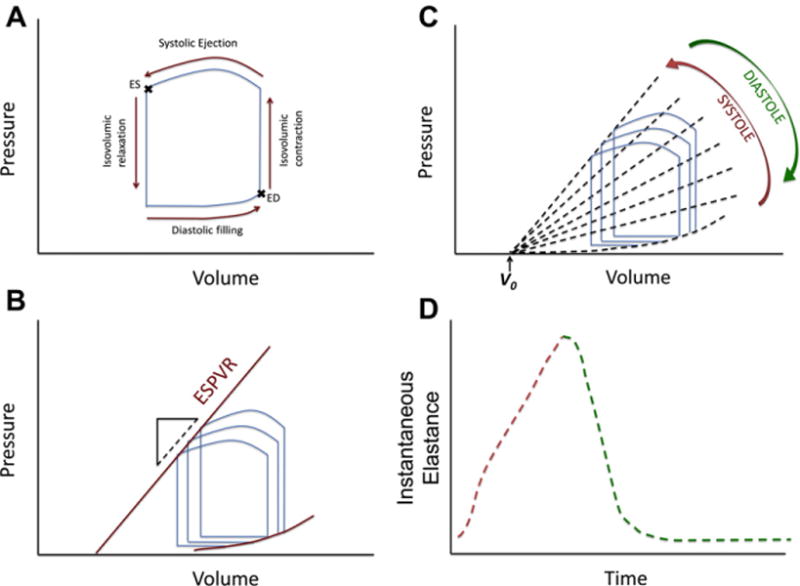
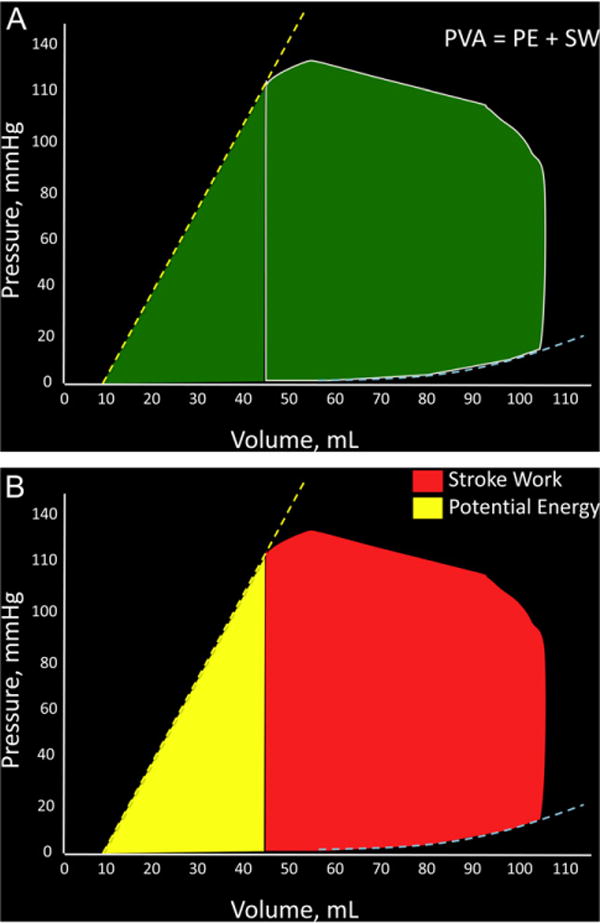
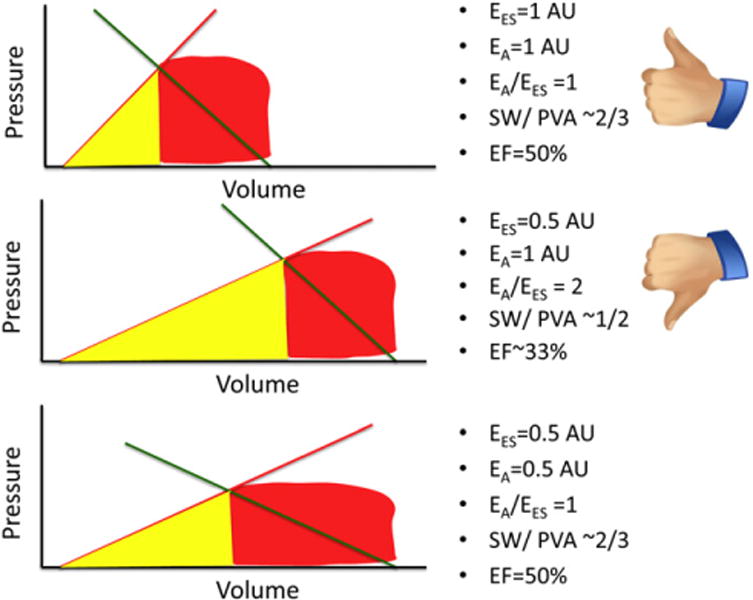
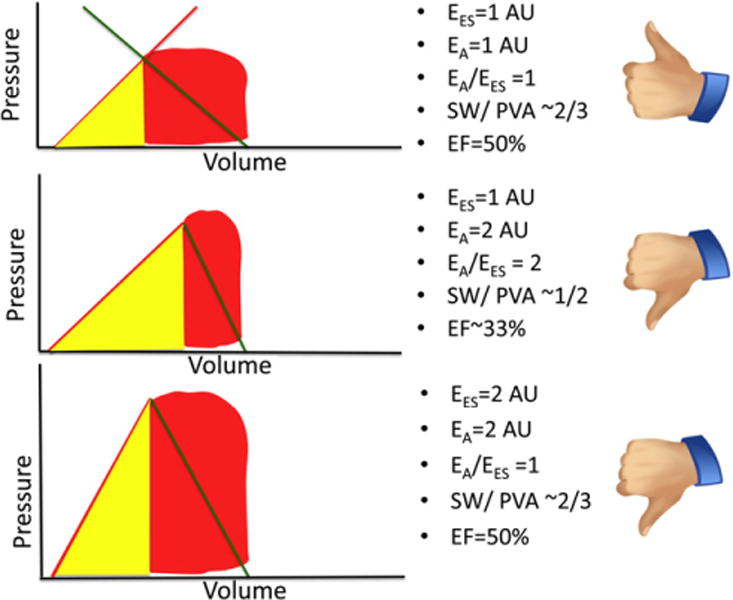
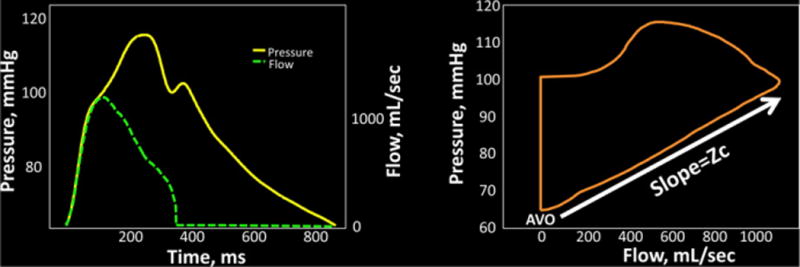
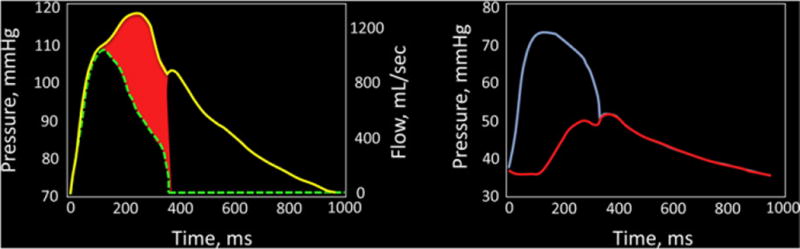
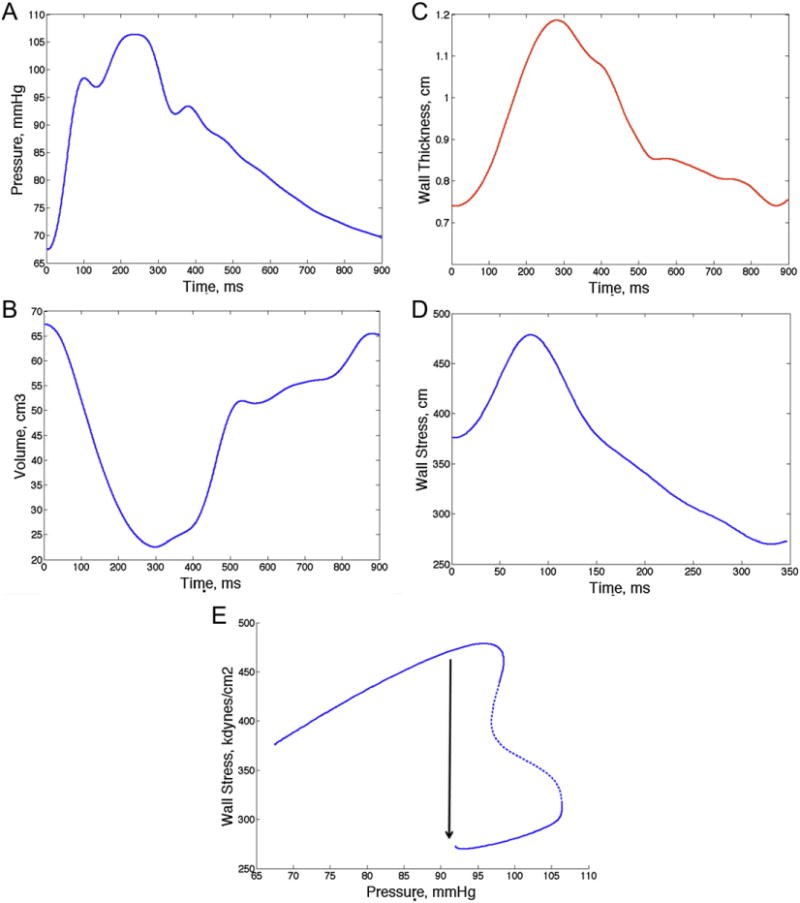
Interactions between the left ventricle (LV) and the arterial system, (ventricular-arterial coupling) are key determinants of cardiovascular function. Ventricularearterial coupling is most frequently assessed in the pressure-volume plane using the ratio of effective arterial elastance (EA) to LV end-systolic elastance (EES). EA (usually interpreted as a lumped index of arterial load) can be computed as end-systolic pressure/stroke volume, whereas EES (a load-independent measure of LV chamber systolic stiffness and contractility) is ideally assessed invasively using data from a family of pressure-volume loops obtained during an acute preload alteration. Single-beat methods have also been proposed, allowing for non-invasive estimations of EES using simple echocardiographic measurements. The EA/EES ratio is useful because it provides information regarding the operating mechanical efficiency and performance of the ventricular-arterial system. However, it should be recognized that analyses in the pressure-volume plane have several limitations and that "ventricular-arterial coupling" encompasses multiple physiologic aspects, many of which are not captured in the pressure-volume plane. Therefore, additional assessments provide important incremental physiologic information about the cardiovascular system and should be more widely used. In particular, it should be recognized that: (1) comprehensive analyses of arterial load are important because EA poorly characterizes pulsatile LV load and does not depend exclusively on arterial properties; (2) The systolic loading sequence, an important aspect of ventricular-arterial coupling, is neglected by pressure-volume analyses, and can profoundly impact LV function, remodeling and progression to heart failure. This brief review summarizes methods for the assessment of ventricular-arterial interactions, as discussed at the Artery 12 meeting (October 2012).

Keywords: Effective arterial elastance; Ventricular afterload; Ventricular elastance; Ventricular-arterial coupling.


Figures

Figure 1
Figure 1
A: LV pressure–volume relation in a single beat; B: End-systolic and end-diastolic pressure–volume relations obtained from a “family” or pressure–volume loops; C: Instantaneous isochrones during the cardiac cycle (note the assumption of a common volume-axis intercept, V0); D: Time-varying elastance curve, obtained from plotting the slope of the isochrones over time.
Figure 2
Figure 2
A: Representation of the pressure–volume area (PVA) of a single beat; B: Breakdown of the PVA into stroke (external) work (red) and potential energy (yellow). (For interpretation of the references to colour in this figure legend, the reader is referred to the web version of this article.)
Figure 3
Figure 3
Panel A shows the strong, linear PVA–MVO2 relation in a single excised heart at a stable contractile state operating under various preload and afterload conditions, as initially reported by Khalafbeigui, Suga and Sagawa. Panels B and C show the authors’ analysis of data from Kameyama et al. (presented in Tables 1 and 2 in reference ) obtained from 11 patients with different contractile states at baseline (B) and after administration of phenylephrine, which increases afterload (C). In contrast to the strong PVA–MVO2 relation seen in individual hearts, the PVA–MVO2 relation is much weaker, due to the great between-heart variability in the slope and particularly, the intercept of the relation (see text for details).
Figure 4
Figure 4
Potential consequences of a primary reduction of EES in energetic aspects of ventricular–arterial coupling. AU = arbitrary units. See text for details.
Figure 5
Figure 5
Potential consequences of a primary increase in EA on ventricular–arterial coupling. AU = arbitrary units. See text for details.
Figure 6
Figure 6
Assessment of aortic characteristic impedance (Zc) in the time domain. The left panel shows a time-aligned pressure–flow pair. Zc can be computed as the ratio of pressure change/flow change in early systole, which is effectively the linear slope of the pressure–flow relation easily identifiably in a flow–pressure loop (right panel). AVO = aortic valve opening.
Figure 7
Figure 7
Wave separation analysis. Once aortic Zc is known, the early systolic pressure–flow relation is characterized and thus pressure and flow can be quantitatively related to each other. One can think of this quantitative relation as one that scales pressure and flow so that their early values are superimposed in a time-resolved pressure and flow plot (left panel). A deviation from the linear relation between pressure and flow occurs upon the arrival of the reflected wave, which increases pressure and reduces flow, thus causing a divergence of the pressure and flow curves. The reflected wave is proportional to the red area in the left panel. The right panel shows separation of the pressure wave into its forward (blue) and reflected (red) components. (For interpretation of the references to colour in this figure legend, the reader is referred to the web version of this article.)
Figure 8
Figure 8
Example of assessments of time-resolved myocardial wall stress. Arterial tonometry can provide a time-resolved pressure curve (A), whereas speckle-tracking echocardiography and other imaging techniques can provide time-resolved LV geometry (B: cavity volume; C: wall thickness). One can thus compute myocardial wall stress at each time point and generate a time-resolved stress curve (D). Notice the early systolic myocardial wall stress peak. E shows a pressure–stress plot, which shows a mid-systolic shift of the pressure–flow relation which favors lower stress values in late systole despite rising pressure. This mechanism may protect the myocardium against wave reflections and may be overcome when there is excessive wave reflection magnitude or intrinsic myocardial dysfunction leading to an abnormal ejection pattern that prevents the mid-systolic shift in the pressure–stress relation.

References

    1. Suga H. Theoretical analysis of a left-ventricular pumping model based on the systolic time-varying pressure–volume ratio. IEEE Trans Biomed Eng. 1971;18:47–55. - PubMed
    1. Suga H. Total mechanical energy of a ventricle model and cardiac oxygen consumption. AmJPhysiol. 1979;236:H498–505. - PubMed
    1. Suga H, Sagawa K, Shoukas AA. Load independence of the instantaneous pressure-volume ratio of the canine left ventricle and effects of epinephrine and heart rate on the ratio. Circ Res. 1973;32:314–22. - PubMed
    1. Suga H, Sagawa K. Mathematical interrelationship between instantaneous ventricular pressure–volume ratio and myocardial force-velocity relation. Ann Biomed Eng. 1972;1:160–81. - PubMed
    1. Borlaug BA, Kass DA. Ventricular–vascular interaction in heart failure. Heart Fail Clin. 2008;4:23–36. - PMC - PubMed

LinkOut - more resources