. 2013 Apr 20:2:549-57.
doi: 10.1016/j.nicl.2013.04.005. eCollection 2013.

Imaging of non-tumorous and tumorous human brain tissues with full-field optical coherence tomography

Affiliations

Imaging of non-tumorous and tumorous human brain tissues with full-field optical coherence tomography

Osnath Assayag et al. Neuroimage Clin. .

Abstract

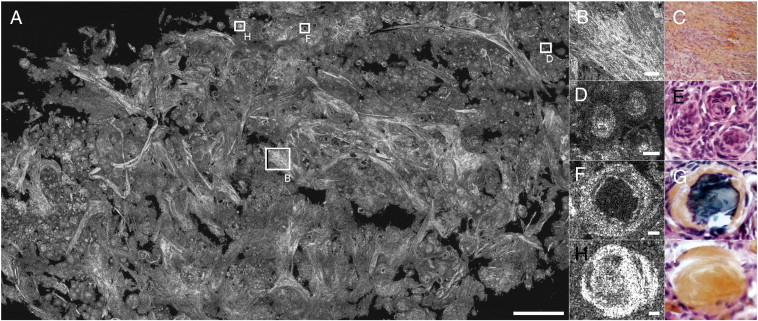
A prospective study was performed on neurosurgical samples from 18 patients to evaluate the use of full-field optical coherence tomography (FF-OCT) in brain tumor diagnosis. FF-OCT captures en face slices of tissue samples at 1 μm resolution in 3D to a penetration depth of around 200 μm. A 1 cm(2) specimen is scanned at a single depth and processed in about 5 min. This rapid imaging process is non-invasive and requires neither contrast agent injection nor tissue preparation, which makes it particularly well suited to medical imaging applications. Temporal chronic epileptic parenchyma and brain tumors such as meningiomas, low-grade and high-grade gliomas, and choroid plexus papilloma were imaged. A subpopulation of neurons, myelin fibers and CNS vasculature were clearly identified. Cortex could be discriminated from white matter, but individual glial cells such as astrocytes (normal or reactive) or oligodendrocytes were not observable. This study reports for the first time on the feasibility of using FF-OCT in a real-time manner as a label-free non-invasive imaging technique in an intraoperative neurosurgical clinical setting to assess tumorous glial and epileptic margins.

Keywords: Brain imaging; Brain tumor; Digital pathology; FF-OCT, full field optical coherence tomography; Glioma; OCT, optical coherence tomography; Optical imaging.


Figures

Fig. 1
Fig. 1
System schematic (A), photograph (B), sample holder close up (C), and sample close up (D).
Fig. 2
Fig. 2
Cortex is distinguished from white matter. (A) Cortex appears gray. (B–C) Neuronal cell bodies (arrows), (D–E) myelinated axon bundles (arrow) leading to white matter, and (F–G) vasculature (arrow). (B and F) Hemalun and phloxin stainings and (D) Luxol blue staining. Rectangles indicate locations of zooms. Scale bars show 500 μm (A), 50 μm (B, C, F, G) and 80 μm (D, E).
Fig. 3
Fig. 3
Hippocampus. CA1 field and stratum radiatum, CA4 field, the hippocampal fissure, the dentate gyrus, and the alveus are distinguished. (A–B) Pyramidal neurons (arrows) of CA4, and (C–D) granular cells constitute the stratum granulosum of the dentate gyrus. (A and C) Hemalun and phloxin stainings. Rectangles indicate locations of zooms. Scale bars show 40 μm (A, B), 80 μm (C, D), and 900 μm (E).
Fig. 4
Fig. 4
Cerebellum. Banding artifacts in this image result from field illumination inhomogeneity due to imperfect alignment of the optical set-up, an artifact that has been minimized in subsequent FF-OCT setups. (A–B) The lamellar or foliar pattern of alternating cortex and central white matter. (C–D, E–F) Zooms show cerebellar cortex and granular layer, and (E–F) Purkinje (arrow) and granular neurons are distinguished as black triangles or dots, respectively, and myelinated axons as bright white lines. (B, D and F) Hemalun and phloxin stainings. Rectangles indicate locations of zooms. Scale bars show 800 μm (A, B), 350 μm (C, D), and 100 μm (E, F).
Fig. 5
Fig. 5
(A) Meningioma psammoma. (B–C) Collagen bundles, (D–E) whorls, (F–G) calcifications, and (H–I) collagen balls. (C, E, G and I) Hemalun and phloxin stainings. Rectangles indicate locations of zooms. Scale bars show 500 μm (A), 50 μm (B, C), and 10 μm (D, E, F, G, H, I).
Fig. 6
Fig. 6
Hemangiopericytoma. (A–B) Collagen network and branching vascular space. Staghorn sinusoids appear white. (C–D) Vessel. (B and D) Hemalun and phloxin stainings. Scale bars show 250 μm.
Fig. 7
Fig. 7
(A) Papilloma — cauliflower-like aspect. (B–E) Empty papilla, (C–D) blood filled papilla, and (D–G) single layer of plexus cells. (E, F and G) Hemalun and phloxin stainings. Rectangles indicate locations of zooms. Scale bars show 150 μm (A), 50 μm (B, C, E, F), 20 μm (D, G).
Fig. 8
Fig. 8
Glioma. Three different cases are shown here (A–B; C–F; G–L). (A–B) Microcysts (arrows) in an oligo-astrocytoma grade 2; (C–D) microcystic areas and Virchow–Robin space (arrows) in an astrocytoma grade 2; (E–F) enlarged Virchow–Robin spaces in an astrocytoma grade 2; (G–H) microvessels (arrow) and tumorous glial cells in an oligo-astrocytoma grade 3; and (I–J) pseudo-palisading necrosis in an oligo-astrocytoma grade 3. Necrosis appears as dark diamond shaped area. White powdery substance in center of dark space (white arrow) is lysed cells (necrotic cells/centers). Dark arrow on histology shows a vessel. (K–L) Vasculature (arrows) in an oligo-astrocytoma grade 3 is immediately visible in white in FF-OCT images, while in histology an additional coloration is required to visualize this feature. (B, D, F, H and J) Hemalun and phloxin stainings and CD34 immunostaining (L). Scale bars show 250 μm (A, B), 100 μm (C–F), 20 μm (G, H), and 10 μm (I–L).

References

    1. Adie, Boppart . SpringerLink; 2009. Optical Coherence Tomography for Cancer Detection; pp. 209–250.
    1. Assayag Large field, high resolution full field optical coherence tomography: a pre-clinical study of human breast tissue and cancer assessment. Technology in Cancer Research & Treatment TCRT Express. 2013;1(1):e600254. - PMC - PubMed
    1. Beck Computer-assisted visualizations of neural networks: expanding the field of view using seamless confocal montaging. Journal of Neuroscience Methods. 2000;98(2):155–163. - PubMed
    1. Ben Arous Single myelin fiber imaging in living rodents without labeling by deep optical coherence microscopy. Journal of Biomedical Optics. 2011;16(11):116012. - PubMed
    1. Betz C.S. A set of optical techniques for improving the diagnosis of early upper aerodigestive tract cancer. Medical Laser Application. 2008;23:175–185.

LinkOut - more resources