

Atypical excitation-inhibition balance in autism captured by the gamma response to contextual modulation
- PMID: 24179850
- PMCID: PMC3791282
- DOI: 10.1016/j.nicl.2013.06.015
Atypical excitation-inhibition balance in autism captured by the gamma response to contextual modulation
Abstract
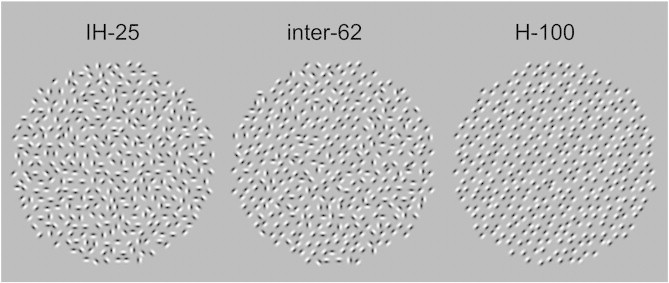
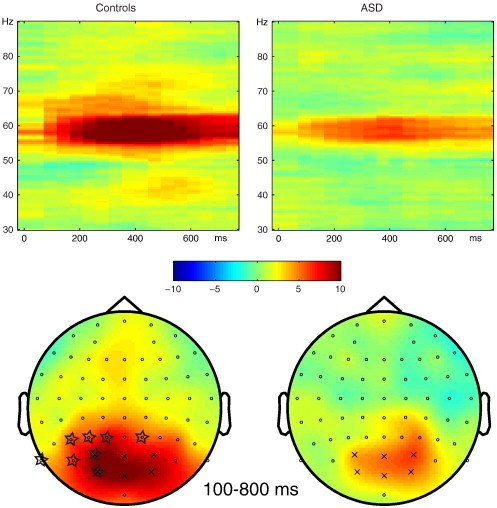
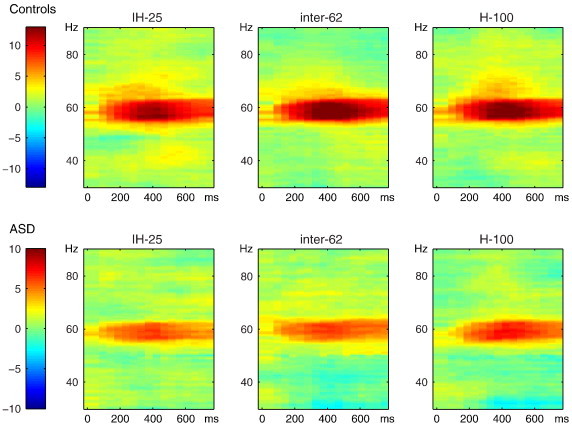
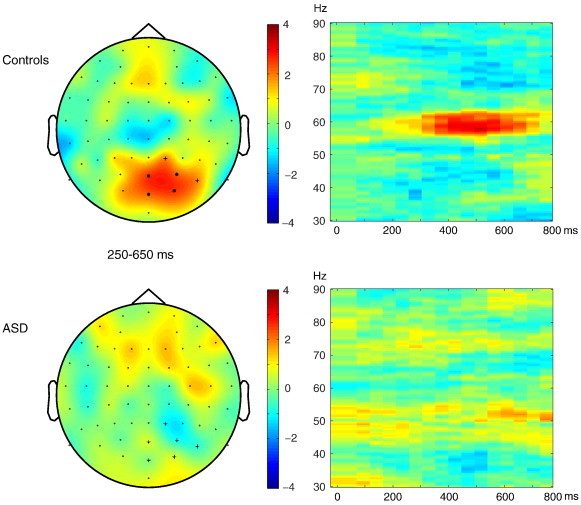
Atypical visual perception in people with autism spectrum disorders (ASD) is hypothesized to stem from an imbalance in excitatory and inhibitory processes in the brain. We used neuronal oscillations in the gamma frequency range (30-90 Hz), which emerge from a balanced interaction of excitation and inhibition in the brain, to assess contextual modulation processes in early visual perception. Electroencephalography was recorded in 12 high-functioning adults with ASD and 12 age- and IQ-matched control participants. Oscillations in the gamma frequency range were analyzed in response to stimuli consisting of small line-like elements. Orientation-specific contextual modulation was manipulated by parametrically increasing the amount of homogeneously oriented elements in the stimuli. The stimuli elicited a strong steady-state gamma response around the refresh-rate of 60 Hz, which was larger for controls than for participants with ASD. The amount of orientation homogeneity (contextual modulation) influenced the gamma response in control subjects, while for subjects with ASD this was not the case. The atypical steady-state gamma response to contextual modulation in subjects with ASD may capture the link between an imbalance in excitatory and inhibitory neuronal processing and atypical visual processing in ASD.
Keywords: Asperger's disorder; EEG; GABA; Gamma oscillations; Surround suppression; Visual perception.
Figures
References
-
- Behrmann M., Thomas C., Humphreys K. Seeing it differently: visual processing in autism. Trends in Cognitive Sciences. 2006;10:258–264. - PubMed
-
- Bertone A., Mottron L., Jelenic P., Faubert J. Enhanced and diminished visuo-spatial information processing in autism depends on stimulus complexity. Brain. 2005;128:2430–2441. - PubMed
-
- Blakemore C., Tobin E.A. Lateral inhibition between orientation detectors in cat's visual cortex. Experimental Brain Research. 1972;15:439–440. - PubMed
-
- Boelte S., Holtmann M., Poustka F., Scheurich A., Schmidt L. Gestalt perception and local–global processing in high-functioning autism. Journal of Autism and Developmental Disorders. 2007;37:1493–1504. - PubMed
-
- Brunel N., Wang X.J. What determines the frequency of fast network oscillations with irregular neural discharges? I. Synaptic dynamics and excitation–inhibition balance. Journal of Neurophysiology. 2003;90:415–430. - PubMed
LinkOut - more resources
Full Text Sources
Other Literature Sources
