. 2013 Aug 3:3:132-42.
doi: 10.1016/j.nicl.2013.07.009. eCollection 2013.

Disrupted cerebral metabolite levels and lower nadir CD4 + counts are linked to brain volume deficits in 210 HIV-infected patients on stable treatment

Affiliations

Disrupted cerebral metabolite levels and lower nadir CD4 + counts are linked to brain volume deficits in 210 HIV-infected patients on stable treatment

Xue Hua et al. Neuroimage Clin. .

Abstract

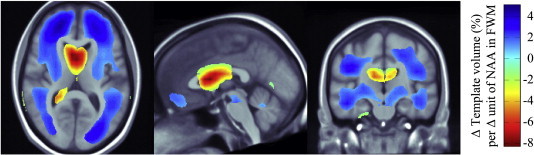
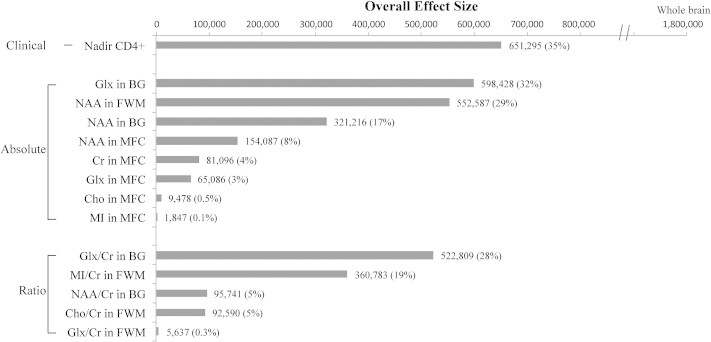
Cognitive impairment and brain injury are common in people with HIV/AIDS, even when viral replication is effectively suppressed with combined antiretroviral therapies (cART). Metabolic and structural abnormalities may promote cognitive decline, but we know little about how these measures relate in people on stable cART. Here we used tensor-based morphometry (TBM) to reveal the 3D profile of regional brain volume variations in 210 HIV + patients scanned with whole-brain MRI at 1.5 T (mean age: 48.6 ± 8.4 years; all receiving cART). We identified brain regions where the degree of atrophy was related to HIV clinical measures and cerebral metabolite levels assessed with magnetic resonance spectroscopy (MRS). Regional brain volume reduction was linked to lower nadir CD4 + count, with a 1-2% white matter volume reduction for each 25-point reduction in nadir CD4 +. Even so, brain volume measured by TBM showed no detectable association with current CD4 + count, AIDS Dementia Complex (ADC) stage, HIV RNA load in plasma or cerebrospinal fluid (CSF), duration of HIV infection, antiretroviral CNS penetration-effectiveness (CPE) scores, or years on cART, after controlling for demographic factors, and for multiple comparisons. Elevated glutamate and glutamine (Glx) and lower N-acetylaspartate (NAA) in the frontal white matter, basal ganglia, and mid frontal cortex - were associated with lower white matter, putamen and thalamus volumes, and ventricular and CSF space expansion. Reductions in brain volumes in the setting of chronic and stable disease are strongly linked to a history of immunosuppression, suggesting that delays in initiating cART may result in imminent and irreversible brain damage.

Keywords: Combined antiretroviral therapy; HIV; Magnetic resonance imaging; Nadir CD4 +; Proton magnetic resonance spectroscopy; Tensor-based morphometry.


Figures

Fig. 1
Fig. 1
Brain atrophy relates to Glx levels measured in BG. 3D maps show regions where the absolute Glx concentrations measured in basal ganglia are significantly associated with regional brain volumes, after controlling for age, sex, ethnicity, and multiple comparisons. Displayed over the MDT, the color-coded regression coefficients, β-values, are shown at each voxel, representing the estimated degree of tissue deficit or excess at each voxel (as a percentage, relative to the template) that is associated with the Glx concentrations measured in BG. Multiple comparisons across voxels are corrected with a regional FDR method; only voxels that survive this statistical correction are shown in color. (For interpretation of the references to color in this figure legend, the reader is referred to the web version of this article.)
Fig. 2
Fig. 2
Brain atrophy relates to NAA levels measured in FWM. Here we show brain regions where the absolute NAA concentrations measured in frontal white matter are significantly associated with regional brain volumes, after controlling for age, sex, ethnicity, and multiple comparisons. Displayed over the MDT, the color-coded regression coefficients, β-values, are shown at each voxel, representing the estimated degree of tissue deficit or excess at each voxel (as a percentage, relative to the template) that is associated with NAA concentrations (in absolute units). Multiple comparisons across voxels are corrected with a regional FDR method; only voxels that survive this statistical correction are shown in color. (For interpretation of the references to color in this figure legend, the reader is referred to the web version of this article.)
Fig. 3
Fig. 3
Brain atrophy relates to nadir CD4 + counts. In people with lower nadir CD4 + counts, brain atrophy is greater in a broad region that encompasses much of the deep white matter (blue colors denote a positive correlation, with lower volumes in people with low CD4 + counts). In brain regions where nadir CD4 + counts are significantly associated with white matter volume, the regression coefficients, β, are shown at each voxel. Results shown are corrected for multiple comparisons, by thresholding them at the critical p-value. The β-values represent the estimated degree of tissue deficit – or enlargement, for CSF spaces – at each voxel (in percentage relative to the template) that is associated with the nadir CD4 + count, after controlling for age, sex, and ethnicity. For each 25-point reduction in nadir CD4 +, there was, on average, a 1–2% greater deficit in white matter volume (in blue regions: β-values range from 0.04 to 0.08%, so 25 times this amounts to a 1–2% volume deficit relative to the template). (For interpretation of the references to color in this figure legend, the reader is referred to the web version of this article.)
Fig. 4
Fig. 4
Which measures best predict brain atrophy? Here we show an ordered ranking of predictors of brain atrophy, divided into clinical characteristics (top), absolute values (middle) and ratios (bottom) of brain metabolite levels. The ranking here is based on the overall effect size, as indicated by the number of significant voxels passing the FDR correction (percentage of the whole brain). This method considers the ability of each measure to predict brain atrophy diffusely throughout the brain, considering both the size of the effect on brain volume, and the proportion of the brain showing detectable associations.

References

    1. Ances B.M., Ellis R.J. Dementia and neurocognitive disorders due to HIV-1 infection. Seminars in Neurology. 2007;27(1):86–92. - PubMed
    1. Antinori A. Updated research nosology for HIV-associated neurocognitive disorders. Neurology. 2007;69(18):1789–1799. - PMC - PubMed
    1. Ashburner J., Friston K.J. Academic Press; 2003. Morphometry. Human Brain Function.
    1. Benjamini Y., Hochberg Y. Controlling the false discovery rate: a practical and powerful approach to multiple testing. Journal of the Royal Statistical Society: Series B. 1995;57:289–300.
    1. Brew B.J. AIDS dementia complex and HIV-1 brain infection: clinical–virological correlations. Annals of Neurology. 1995;38(4):563–570. - PubMed