Review
. 2013 Nov;9(6):817-48.
doi: 10.2217/fca.13.66.

Pediatric cardiomyopathies: causes, epidemiology, clinical course, preventive strategies and therapies

Affiliations
Review

Pediatric cardiomyopathies: causes, epidemiology, clinical course, preventive strategies and therapies

Steven E Lipshultz et al. Future Cardiol. 2013 Nov.

Abstract

Pediatric cardiomyopathies, which are rare but serious disorders of the muscles of the heart, affect at least one in every 100,000 children in the USA. Approximately 40% of children with symptomatic cardiomyopathy undergo heart transplantation or die from cardiac complications within 2 years. However, a significant number of children suffering from cardiomyopathy are surviving into adulthood, making it an important chronic illness for both pediatric and adult clinicians to understand. The natural history, risk factors, prevalence and incidence of this pediatric condition were not fully understood before the 1990s. Questions regarding optimal diagnostic, prognostic and treatment methods remain. Children require long-term follow-up into adulthood in order to identify the factors associated with best clinical practice including diagnostic approaches, as well as optimal treatment approaches. In this article, we comprehensively review current research on various presentations of this disease, along with current knowledge about their causes, treatments and clinical outcomes.


Figures

Figure 1
Figure 1. Stages in the course of pediatric ventricular dysfunction
Review of the stages in the course of pediatric ventricular dysfunction that can be followed by echocardiographic measurements of left ventricular structure and function in conjunction with cardiac biomarkers that have been validated as surrogates for clinically significant cardiac end points. The identification of risk factors and high-risk populations for ventricular dysfunction are highlighted where their use may lead to preventive or early therapeutic strategies, while the determination of etiology may lead to etiology-specific therapies. Points (1–5) indicate stage-related points of intervention for preventive and therapeutic strategies, and where biomarkers and surrogate markers may be used. ? indicates that the role of adrenergic status is unknown. Reproduced with permission from [21].
Figure 2
Figure 2. Freedom from death or transplantation for patients with pure dilated cardiomyopathy
DCM: Dilated cardiomyopathy; No.: Number. Reproduced with permission from [5].
Figure 3
Figure 3. Survival from time of diagnosis of cardiomyopathy, by diagnosis
BMD: Becker muscular dystrophy; DMD: Duchenne muscular dystrophy; ODCM: Other dilated cardiomyopathy. Reproduced with permission from [18].
Figure 4
Figure 4. Freedom from transplantation after diagnosis of cardiomyopathy, by diagnosis
BMD: Becker muscular dystrophy; DMD: Duchenne muscular dystrophy; ODCM: Other dilated cardiomyopathy. Reproduced with permission from [18].
Figure 5
Figure 5. Competing risk analysis: outcomes in children with dilated cardiomyopathy
Competing risk analysis for sudden cardiac death, nonsudden cardiac death, unknown cause of death and cardiac transplantation among 1803 children with dilated cardiomyopathy listed in the Pediatric Cardiomyopathy Registry. The 3-, 5- and 10-year cumulative incidence rates (95% CI) of sudden cardiac death are estimated to be 2.0% (1.4–2.8%), 2.4% (1.7–3.4%) and 2.7% (1.8–3.9%), respectively; of nonsudden cardiac death, 10.8% (9.3–12.4%), 12.1% (10.4–13.9%) and 14.9% (12.6–17.3%), respectively; and of heart transplantation, 27% (25–29%), 29% (27–32%) and 31% (28–34%), respectively. The rate of death of unknown cause (95% CI) was 3.4% (2.6–4.5%), 4.0% (3.0–5.2%) and 5.2 (3.6–7.3%), respectively. DCM: Dilated cardiomyopathy. Reproduced with permission from [22].
Figure 6
Figure 6. Survival after listing for heart transplantation among children with cardiomyopathy by heart failure severity score
2: Children on mechanical ventilatory or circulatory support; 1: Children on intravenous inotropic support without mechanical support; 0: Children on neither intravenous inotropic nor mechanical support. Reproduced with permission from [23].
Figure 7
Figure 7. Competing risk estimates of death, cardiac transplantation and survival for children with dilated cardiomyopathy
Caused by (A) idiopathic dilated cardiomyopathy (n = 1192), (B) neuromuscular disease (n = 139), (C) familial isolated dilated cardiomyopathy (n = 79) and (D) myocarditis (n = 272). Reproduced with permission from [17].
Figure 8
Figure 8. Crude cumulative incidences of echocardiographic normalization, cardiac transplantation and death among children with myocarditis (combined biopsy-confirmed myocarditis and probable myocarditis groups), and abnormal function at presentation
(A) With or (B) without left ventricular end-diastolic dilation at diagnosis. The two groups differed in the incidence of cardiac transplant (p = 0.02) and echocardiographic normalization rates (p < 0.001), but not mortality (p = 0.45). Curves are truncated at 8 years. Reproduced with permission from [25].
Figure 9
Figure 9. Kaplan–Meier survival curve for the first 2 years after listing (censored at transplantation) for children with dilated cardiomyopathy
n = 261; 26 deaths by 2 years after listing. Error bar represents 70% confidence limits. Reproduced with permission from [26].
Figure 10
Figure 10. Kaplan–Meier post-transplantation survival curve. (A)
Children with dilated cardiomyopathy (n = 209); (B) children <1, 1–10 and >10 years of age at transplantation; and (C) nonwhite versus white children. Error bars represent 70% confidence limits. Dashes are included where there is an insufficient sample size to continue the Kaplan–Meier curves. Reproduced with permission from [26].
Figure 11
Figure 11. Kaplan–Meier post-transplant survival and freedom from rejection curves for children with myocarditis versus no myocarditis
(A) Survival curves for children with the diagnosis of myocarditis versus no myocarditis (at presentation). (B) Compares freedom from rejection death after transplantation for children with the diagnosis of myocarditis versus no myocarditis. Error bars represent 70% confidence limits. Dashes are included where there is an insufficient sample size to continue the Kaplan–Meier curves. Myo: Myocarditis. Reproduced with permission from [26].
Figure 12
Figure 12. Primary causes of 61 cases of hypertrophic cardiomyopathy and 77 cases of dilated cardiomyopathy in patients diagnosed from 1996 to 1999
The primary causes of the remaining 135 cases of hypertrophic cardiomyopathy and 162 cases of dilated cardiomyopathy were unknown at diagnosis. Reproduced with permission from [2].
Figure 13
Figure 13. Survival rates for the end points of death and death or transplant for children with hypertrophic cardiomyopathy
Survival rates from diagnosis of cardiomyopathy to (A) death (log-rank p < 0.001) and (B) death or transplantation (log-rank p < 0.001) in the combined prospective and retrospective cohorts (n = 855) by age at diagnosis (<1, 1 to <6, 6 to <12, and 12 to <18 years). Reproduced with permission from [31].
Figure 14
Figure 14. Survival rates for children with hypertrophic cardiomyopathy with and without Noonan syndrome, and by risk factors at diagnosis for those with Noonan syndrome
(A) Estimated survival since diagnosis of HCM in children with (n = 74) and without (n = 792) NS; log-rank p = 0.03. The size of the risk set is shown below the x-axis. (B) Survival by left ventricular FS Z-score in children with NS and HCM. Estimated survival since diagnosis of HCM in 48 children with NS by LV FS Z-score at the time of HCM diagnosis (<6.35 vs ≥6.35 to where 6.35 is the median). Log-rank p = 0.02. The 5-year survival is 59% for children with a Z-score <6.35 and 90% for children with a Z-score ≥6.35. The size of the risk set is shown below the x-axis. (C) Survival by age and CHF in children with NS and HCM. Estimated survival since diagnosis of HCM in 74 children with NS by age and CHF status at the time of HCM diagnosis (log-rank p < 0.001). The size of the risk set is shown below the x-axis. The subgroup of three cases with CHF who were diagnosed at age ≥6 months is not shown (one known to survive 5.5 months postdiagnosis and two were not seen after diagnosis). CHF: Congestive heart failure; CM: Cardiomyopathy; FS: Fractional shortening of left ventricle; HCM: Hypertrophic cardiomyopathy; NS: Noonan syndrome. Reproduced with permission from [41].
Figure 15
Figure 15. Probability of freedom from death (censored at transplantation) among 3375 children diagnosed with cardiomyopathy in the Pediatric Cardiomyopathy Registry, stratified by type of cardiomyopathy
CM: Cardiomyopathy; DCM: Dilated cardiomyopathy; HCM: Hypertrophic cardiomyopathy; RCM: Restrictive cardiomyopathy. Reproduced with permission from [42].
Figure 16
Figure 16. Survival curves for children with pure restrictive cardiomyopathy compared with those with a mixed restrictive and hypertrophic cardiomyopathy phenotype
(A) Probability of freedom from death (censored at transplantation), (B) transplantation and (C) death or transplantation among 152 children with RCM stratified by phenotype (pure RCM vs mixed/overlapping phenotype RCM/HCM). CM: Cardiomyopathy; HCM: Hypertrophic cardiomyopathy; RCM: Restrictive cardiomyopathy. Reproduced with permission from [42].
Figure 17
Figure 17. Characteristics of the normal heart and the three main types of cardiomyopathy
AO: Aorta; LA: Left atrium; LV: Left ventricle. Reproduced with permission from [225].
Figure 18
Figure 18. Equalization of right ventricular and left ventricular end-diastolic pressures with a ‘dip and plateau’ pattern
ECG was recorded at a chart speed of 50 mm/s. LV: Left ventricular; RV: Right ventricular.
Figure 19
Figure 19. Correlations between plasma FGF-23 levels and echocardiographic measurement of cardiac hypertrophy
(A) LVMI and (B) Z-score of interventricular septal thickness correlated positively with log-transformed FGF-23 levels measured with C-terminal assay. Dashed lines represent 95% CIs. LVMI: Left ventricular mass index; RU: Relative units. Reproduced with permission from [179].

References

    1. Wilkinson JD, Sleeper LA, Alvarez JA, Bublik N, Lipshultz SE for the Pediatric Cardiomyopathy Study Group. The pediatric cardiomyopathy registry: 1995–2007. Prog Pediatr Cardiol. 2008;25(1):31–36. - PMC - PubMed
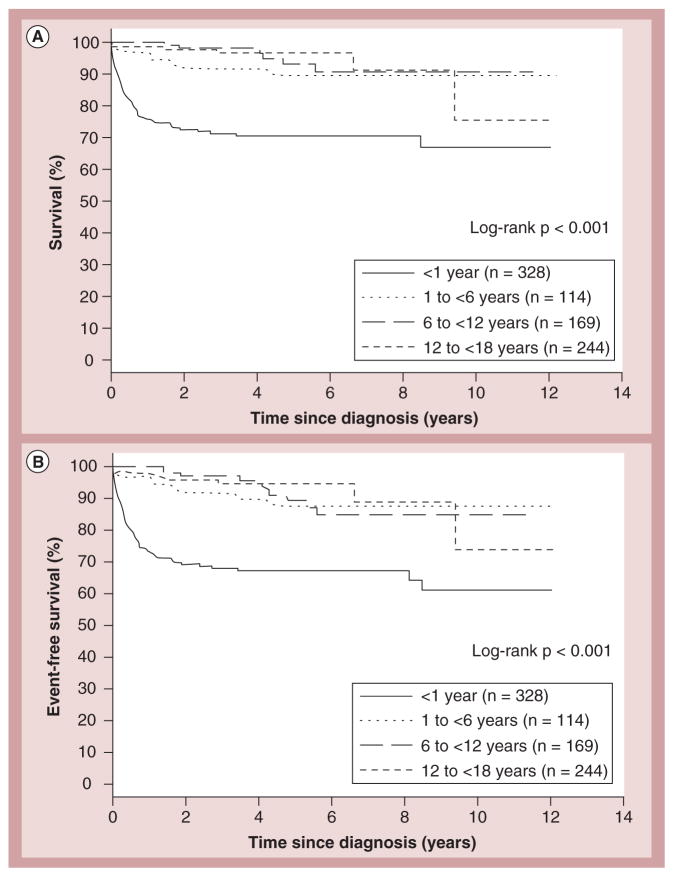
    1. Lipshultz SE, Sleeper LA, Towbin JA, et al. The incidence of pediatric cardiomyopathy in two regions of the United States. N Engl J Med. 2003;348(17):1647–1655. Found that the incidence of cardiomyopathy was significantly higher in children younger than 1 year old. The estimated incidence of pediatric cardiomyopathy was determined to be 1.13 cases per 100,000 children. Incidence varied according to sex, region and racial origin. - PubMed
    1. Bublik N, Alvarez JA, Lipshultz SE. Pediatric cardiomyopathy as a chronic disease: a perspective on comprehensive care programs. Prog Pediatr Cardiol. 2008;25(1):103–111. - PMC - PubMed
    1. Alvarez JA, Wilkinson JD, Lipshultz SE for the Pediatric Cardiomyopathy Registry Study Group. Outcome predictors for pediatric dilated cardiomyopathy: a systematic review. Prog Pediatr Cardiol. 2007;23(1):25–32. - PMC - PubMed
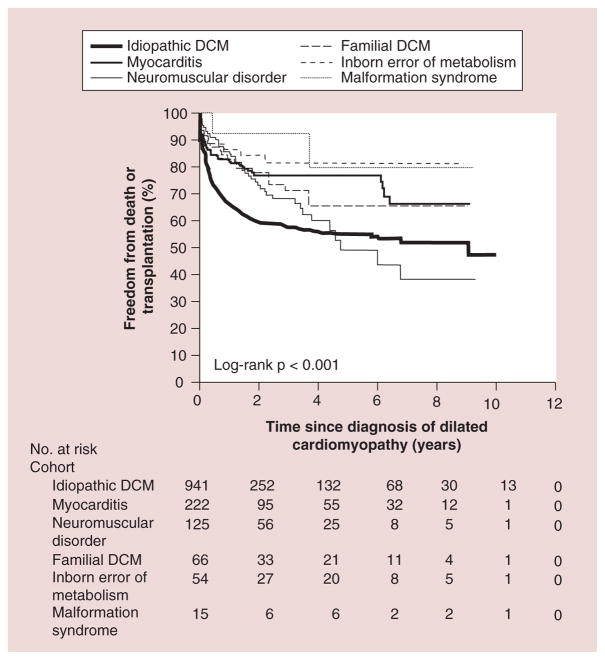
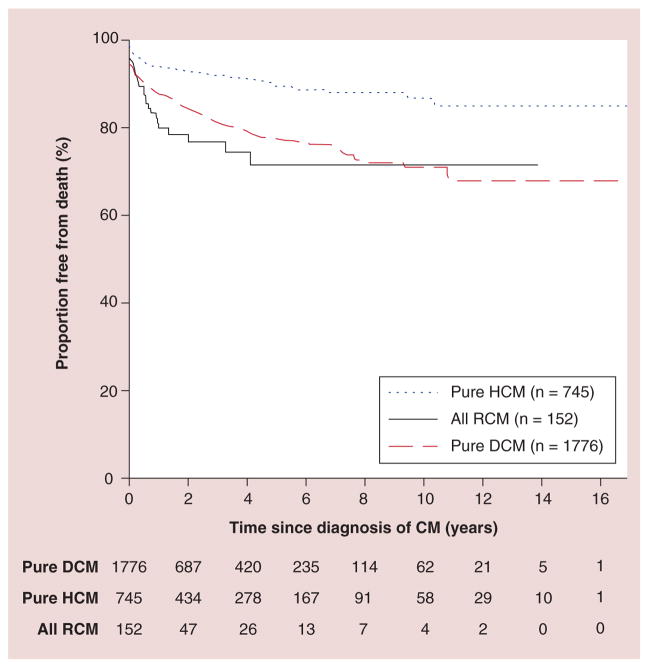
    1. Towbin JA, Lowe AM, Colan SD, et al. Incidence, causes, and outcomes of dilated cardiomyopathy in children. JAMA. 2006;296(15):1867–1876. Found that the annual incidence of dilated cardiomyopathy in children younger than 18 years of age was 0.57 cases per 100,000. It also found that annual incidence was higher in boys than girls. The majority of children had idiopathic disease, with the most common causes being myocarditis and neuromuscular disease. - PubMed