. 2013 Nov 26;7(11):9611-20.
doi: 10.1021/nn405075d. Epub 2013 Nov 7.

Self-propelled micromotors for cleaning polluted water

Affiliations

Self-propelled micromotors for cleaning polluted water

Lluís Soler et al. ACS Nano. .

Abstract

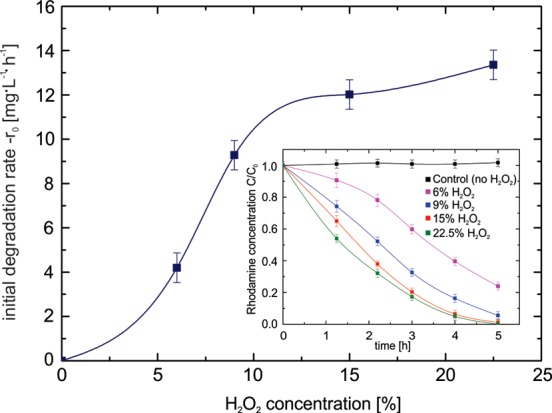
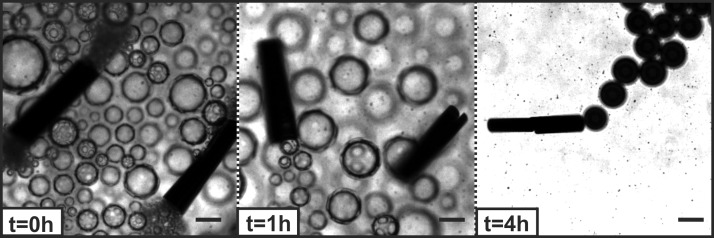
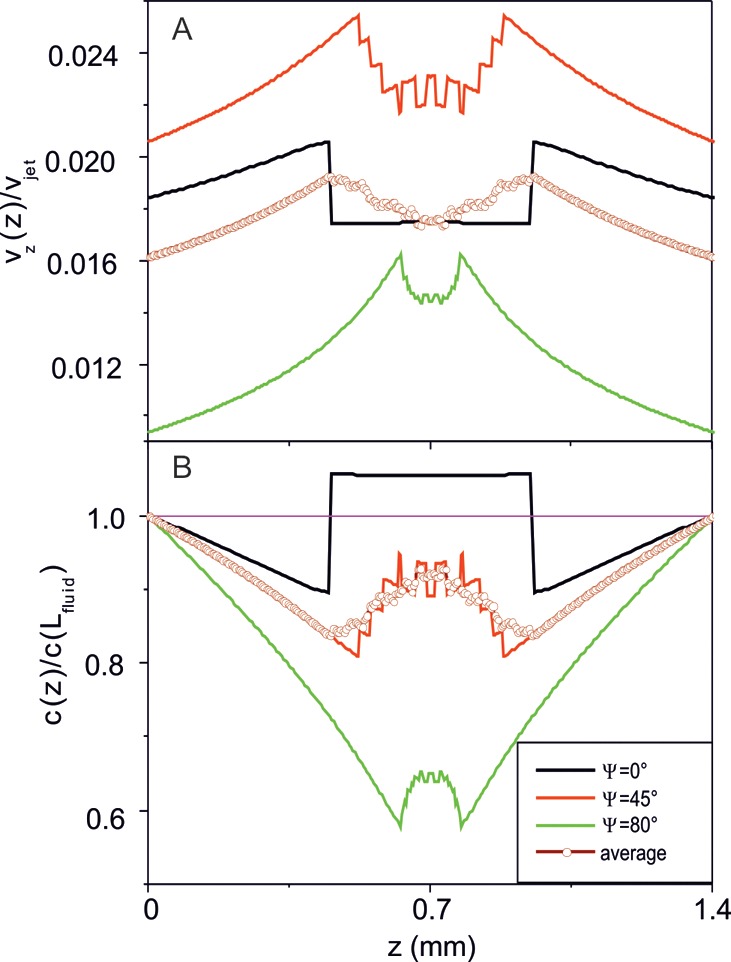
We describe the use of catalytically self-propelled microjets (dubbed micromotors) for degrading organic pollutants in water via the Fenton oxidation process. The tubular micromotors are composed of rolled-up functional nanomembranes consisting of Fe/Pt bilayers. The micromotors contain double functionality within their architecture, i.e., the inner Pt for the self-propulsion and the outer Fe for the in situ generation of ferrous ions boosting the remediation of contaminated water.The degradation of organic pollutants takes place in the presence of hydrogen peroxide, which acts as a reagent for the Fenton reaction and as main fuel to propel the micromotors. Factors influencing the efficiency of the Fenton oxidation process, including thickness of the Fe layer, pH, and concentration of hydrogen peroxide, are investigated. The ability of these catalytically self-propelled micromotors to improve intermixing in liquids results in the removal of organic pollutants ca. 12 times faster than when the Fenton oxidation process is carried out without catalytically active micromotors. The enhanced reaction-diffusion provided by micromotors has been theoretically modeled. The synergy between the internal and external functionalities of the micromotors, without the need of further functionalization, results into an enhanced degradation of nonbiodegradable and dangerous organic pollutants at small-scale environments and holds considerable promise for the remediation of contaminated water.


Figures

Figure 1
Figure 1
Schematic process for the degradation of polluted water (rhodamine 6G as model contaminant) into inorganic products by multifunctional micromotors. The self-propulsion is achieved by the catalytic inner layer (Pt), which provides the motion of the micromotors in H2O2 solutions. The remediation of polluted water is achieved by the combination of Fe2+ ions with peroxide, generating HO• radicals, which degrade organic pollutants.
Figure 2
Figure 2
Removal of toxic organic compounds from aqueous solutions with pure iron microtubes (column A) and catalytically active iron/platinum (Fe/Pt) microjets (column B) in hydrogen peroxide solutions. Pink molecules represent rhodamine 6G (Rh6G); the small blue molecules represent oxidized compounds and carbon dioxide as reaction products. Pollutant Rh6G is removed faster when the solution contains active Fe/Pt microjets (column B) than containing nonactive pure iron microtubes (column A). Quantitative comparison of Rh6G degradation by pure iron (Fe) tubes (red triangles) and by catalytically active Fe/Pt tubes (blue diamonds) over 5 h. All samples were prepared at pH 2.5, with Rh6G (C0 = 45 mg/L), 15% H2O2, 0.5% sodium dodecyl sulfate as surfactant, and 441 ± 10 microtubes in a total volume of 1 mL. Controls without H2O2 and without microtubes were added for comparison.
Figure 3
Figure 3
Optimization of Fe thickness for efficient pollutant degradation using Fe/Pt micromotors. (A) Rhodamine 6G degradation over time with self-propelled micromotors containing different Fe thickness, i.e., from 20 to 200 nm, and constant Pt thickness at 1 nm. Each sample contained a 2 mL solution at pH 2.5 with Rh6G (C0 = 100 mg/L), 5% H2O2, 1% SDS, and 882 ± 10 microtubes. The control sample was carried out under equal conditions omitting micromotors. Inset: Actively moving Fe/Pt micromotors in Rh6G solution. Scale bar: 250 μm. (B) SEM images of Fe tubes with 100 nm Fe thickness before Fenton reaction and (C) after 20 h of Fenton reaction. The blue triangles indicate the position of nanopits in tube walls.
Figure 4
Figure 4
Effect of the concentration of hydrogen peroxide on the oxidation of rhodamine 6G. The main plot illustrates the initial rates of oxidation of Rh6G using different concentrations H2O2. Inset shows the oxidation of Rh6G over time using Fe/Pt micromotors with increasing H2O2 concentration over time. All samples were prepared with Rh6G (C0 = 44 mg/L) and 1% SDS.
Figure 5
Figure 5
Motion of Fe/Pt micromotors versus time: Fe 100 nm/Pt 1 nm Fenton micromotors, scale bar 125 μm. The experiment was prepared at pH 2.5, with Rh6G (C0 = 45 mg/L), 5% H2O2, 1% SDS, and micromotors in a total volume of 2 mL.
Figure 6
Figure 6
Mixing with self-propelled micromotors. (A) Improved mixing of solutions on the macroscopic scale over time. (Left) Control solutions without micromotors and catalytic Fe/Pt micromotors (right) containing a sample with ca. 400 actively moving microtubes (Fe 100 nm/Pt 1 nm). All beakers contain 3 mL of solution (6% H2O2, 1% SDS, and 10 μL of black ink as dye to visualize diffusion). (B) Trajectories (colored lines) of 3 μm diameter green fluorescing particles near a tube opening of a 500 μm Fe/Pt micromotor over 3.3 s. (C) Control experiment with trajectories (colored lines) of the same sized fluorescing microparticles without microtubes as micromixers. In B and C, a total volume of 200 μL contained 1.5% H2O2 with 0.5% SDS and 10 μL of 3 μm green fluorescing microparticles. Scale bar is 100 μm. Insets B and C show representative trajectories of three particles for each corresponding case.
Figure 7
Figure 7
Average z-component of the fluid velocity related to the microjet velocity (A) and the peroxide concentration related to its undisturbed value far away from the moving microjet (B) calculated as a function of the vertical coordinate z for model microjets centered at the half-height of the fluid in the vertical direction (0.5 × Lfluid). The values of the angle Ψ between the microjet velocity vjet and the vertical z-axis are given in the inset. The results averaged over an ensemble of microjets with different values of the angle Ψ are represented with open circles. The pink thin line in panel (B) represents the undisturbed value of peroxide concentration far away from the moving microjet. Calculation parameters are given in the text.

Similar articles

Cited by

References

    1. Khin M. M.; Nair A. S.; Babu V. J.; Murugan R.; Ramakrishna S. A Review on Nanomaterials for Environmental Remediation. Energy Environ. Sci. 2012, 5, 8075–8109.
    1. Andreozzi R.; Caprio V.; Insola A.; Marotta R. Advanced Oxidation Processes (AOP) for Water Purification and Recovery. Catal. Today 1999, 53, 51–59.
    1. Brillas E.; Sires I.; Oturan M. A. Electro-Fenton Process and Related Electrochemical Technologies Based on Fenton’s Reaction Chemistry. Chem. Rev. 2009, 109, 6570–6631. - PubMed
    1. Venny; Gan S. Y.; Ng N. K. Current Status and Prospects of Fenton Oxidation for the Decontamination of Persistent Organic Pollutants (POPs) in Soils. Chem. Eng. J. 2012, 213, 295–317.
    1. Hartmann M.; Kullmann S.; Keller H. Wastewater Treatment with Heterogeneous Fenton-Type Catalysts Based on Porous Materials. J. Mater. Chem. 2010, 20, 9002–9017.

Publication types