

Review
doi: 10.1016/j.neuron.2013.10.002.
Scaling brain size, keeping timing: evolutionary preservation of brain rhythms
Affiliations
- PMID: 24183025
- PMCID: PMC4009705
- DOI: 10.1016/j.neuron.2013.10.002
Item in Clipboard
Review
Scaling brain size, keeping timing: evolutionary preservation of brain rhythms
Neuron.
.
Abstract
Despite the several-thousand-fold increase of brain volume during the course of mammalian evolution, the hierarchy of brain oscillations remains remarkably preserved, allowing for multiple-time-scale communication within and across neuronal networks at approximately the same speed, irrespective of brain size. Deployment of large-diameter axons of long-range neurons could be a key factor in the preserved time management in growing brains. We discuss the consequences of such preserved network constellation in mental disease, drug discovery, and interventional therapies.
Copyright © 2013 Elsevier Inc. All rights reserved.
Figures
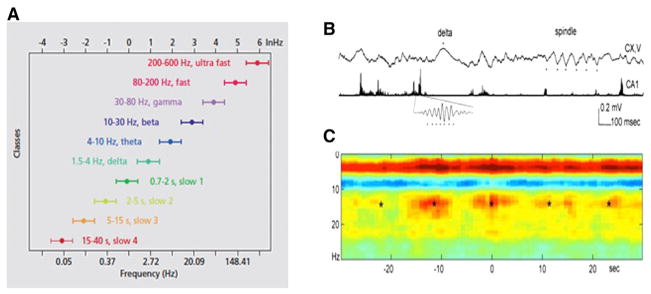
(A) A system of interacting brain oscillations. Oscillatory classes in the cortex. Note the linear progression of the frequency classes, together with its commonly used term, on the natural log scale. Note also that the log-frequency variance relative to that of the band frequencies remains constant. (B and C) Cross-frequency coupling contributes to the hierarchy of brain rhythms. (B) Local-field-potential trace from layer 5 of the rat neocortex (1–3 kHz) and a filtered (140–240 Hz) and rectified derivative of a trace from the hippocampal CA1 pyramidal layer, illustrating the emergence of “ripples.” One ripple event is shown at an expanded time scale. The peak of a delta wave and troughs of a sleep spindle are marked by asterisks. (C) Hippocampal ripple-triggered power spectrogram of neocortical activity centered on hippocampal ripples. Note that ripple activity is modulated by the sleep spindles (as revealed by the power in the 10–18 Hz band), both events are modulated by the slow oscillation (strong red band at 0–3 Hz), and all three oscillations are biased by the phase of the ultraslow rhythm (approximately 0.1 Hz; asterisks). Panel (A) is reproduced from Penttonen and Buzsáki (2003); panels (B) and (C) are reproduced from Sirota et al. (2003).
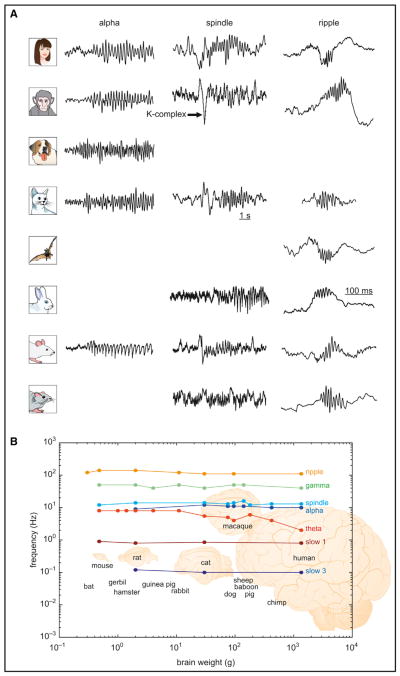
(A) Illustrative traces of neocortical alpha oscillations, sleep spindles, and hippocampal CA1 ripples in various species. An arrow points to a K complex preceding the spindle. Note the similarity of frequency, evolution, and waveforms of the respective patterns across species. (B) Relationship between brain weight and frequency of the various rhythm classes on a log-log scale. Note the small variation of frequency changes despite increases in brain weight of several orders of magnitude. Extensive literature sources for data shown here are listed in Supplemental Note 3. The human alpha trace is courtesy of Wolfgang Klimesch (Klimesch, 1997); macaque alpha is courtesy of Charles Schroeder (Bollimunta et al., 2008); dog alpha is from da Silva et al., 1973; human spindle is from Nir et al., 2011; cat spindle is from Hughes et al., 2004; rabbit spindle is from Bereshpolova et al., 2007; rat spindle is from Peyrache et al., 2011; human ripple is from Bragin et al., 1999; macaque spindle is from Skaggs et al., 2007; cat ripple is from Kanamori, 1985; bat ripple is reprinted from Ulanovsky and Moss, 2007; and rabbit ripple is reprinted from Nokia et al., 2010.
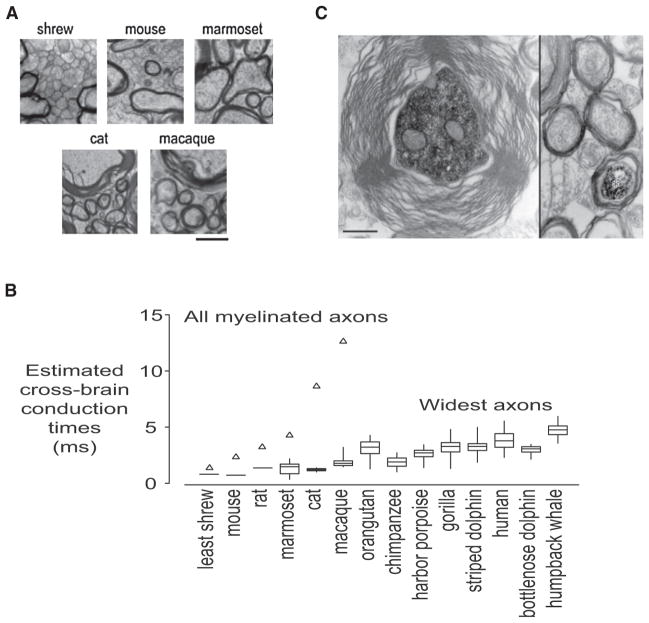
(A) Representative micrographs of callosal tissue in different species. The scale bar represents 1 μm. (B) Estimated cross-brain conduction times for myelinated axons (average values; open triangles) and the widest axons (box plots). The widest axons were taken to be the widest 10 axons per 10,000 μm2, except for shrew, mouse, and rat, in which case the widest observed axon was used. Note only a few-fold change of the fastest cross-brain conduction time across species and compare this to the rapidly increasing conduction times for all myelinated axons. (C) Some of the large-caliber axons might belong to long-range inhibitory neurons. (Left) Cross-section of the neurobiotin-labeled main axon of an intracellularly filled hippocamal CA1 interneuron. (Right) A neurobiotin-labeled main axon of a CA1 pyramidal cell (asterisk) is surrounded by similar axons. Note the difference in diameter and myelin thickness between the axons of the interneuron and pyramidal cell. (A and B) Reproduced from Wang et al., 2008. (C) Reproduced from Jinno et al. (2007).
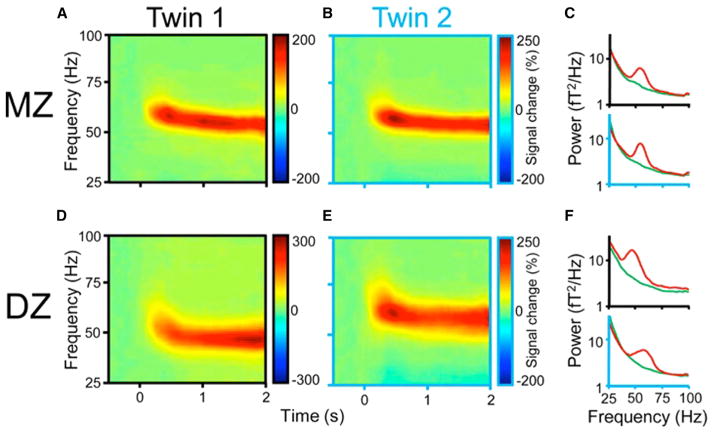
(A and B) Time-frequency display of visually induced gamma-band activity in a monozygotic (MZ) twin pair. (C) Average spectral power of magnetoencephalogram activity during control (green) and visual stimulation (red) epochs. (D–F), same as (A–C) but in a dizygotic (DZ) twin pair. Note the stronger similarity of frequency and temporal dynamic changes of the MEG in the MZ pair relative to the DZ pair. Reproduced from van Pelt et al. (2012).
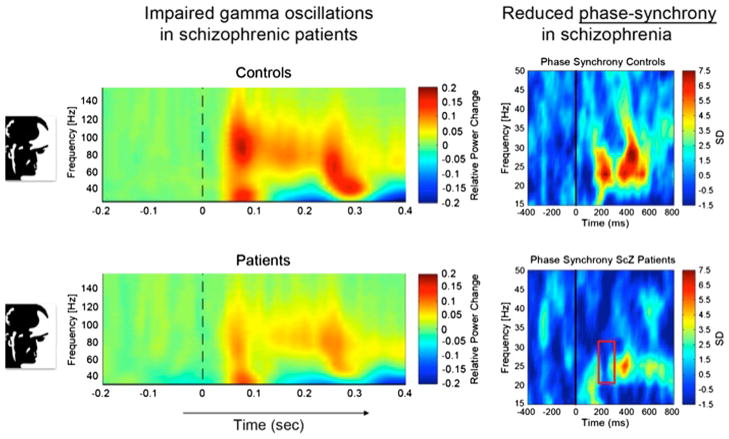
Subjects were presented with Moony faces (left inserts) and were asked to report recognition. Left panels: Time-frequency plots of the power (color scale) of gamma oscillations (frequency on ordinate) after presentation of the stimulus (T0 on abscissa). Right panels: Precision of phase locking of beta oscillations (frequency on ordinate) across sensors (color scale) after stimulus presentation (T0 on abscissa). Upper panels: Healthy control subjects. Lower panels: Schizophrenic patients. Note the reduced power of gamma oscillations induced by the cognitive task (perceptual closure) and the drastically reduced phase synchronization in patients. Adapted from Uhlhaas et al., 2006.
References
-
- Aboitiz F, López J, Montiel J. Long distance communication in the human brain: timing constraints for inter-hemispheric synchrony and the origin of brain lateralization. Biol Res. 2003;36:89–99. - PubMed
-
- Agid Y, Buzsáki G, Diamond DM, Frackowiak R, Giedd J, Girault JA, Grace A, Lambert JJ, Manji H, Mayberg H, et al. How can drug discovery for psychiatric disorders be improved? Nat Rev Drug Discov. 2007;6:189–201. - PubMed
-
- Albert R, Barabási AL. Statistical mechanics of complex networks. Rev Mod Phys. 2002;74:47–97.
-
- Alhaj H, Wisniewski G, McAllister-Williams RH. The use of the EEG in measuring therapeutic drug action: focus on depression and antidepressants. J Psychopharmacol (Oxford) 2011;25:1175–1191. - PubMed
-
- Allman J. Evolving Brains. New York: Scientific American Library; 1999.
Publication types
MeSH terms
Grants and funding
LinkOut - more resources
Full Text Sources
Other Literature Sources
