. 2013 Nov 11;27(3):319-30.
doi: 10.1016/j.devcel.2013.09.001. Epub 2013 Oct 31.

Luminal mitosis drives epithelial cell dispersal within the branching ureteric bud

Affiliations

Luminal mitosis drives epithelial cell dispersal within the branching ureteric bud

Adam Packard et al. Dev Cell. .

Abstract

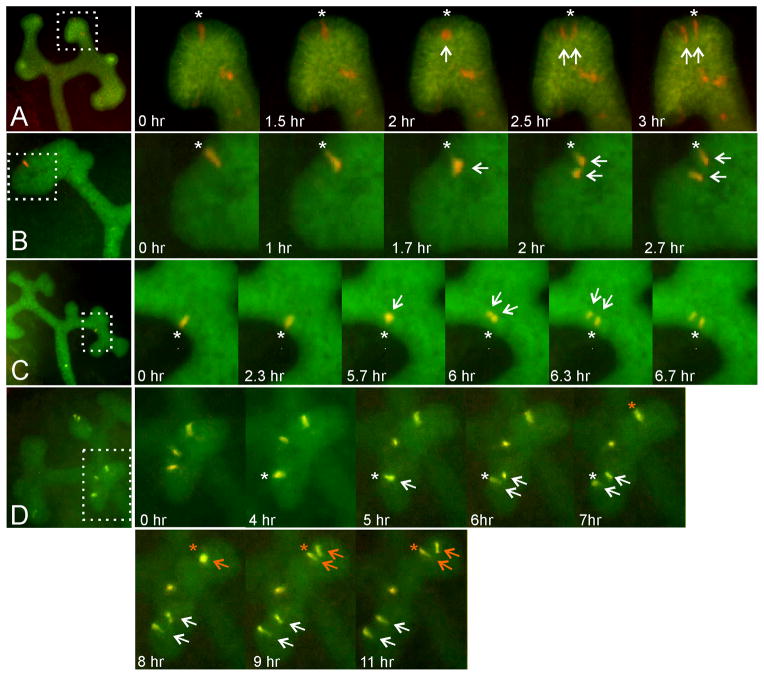
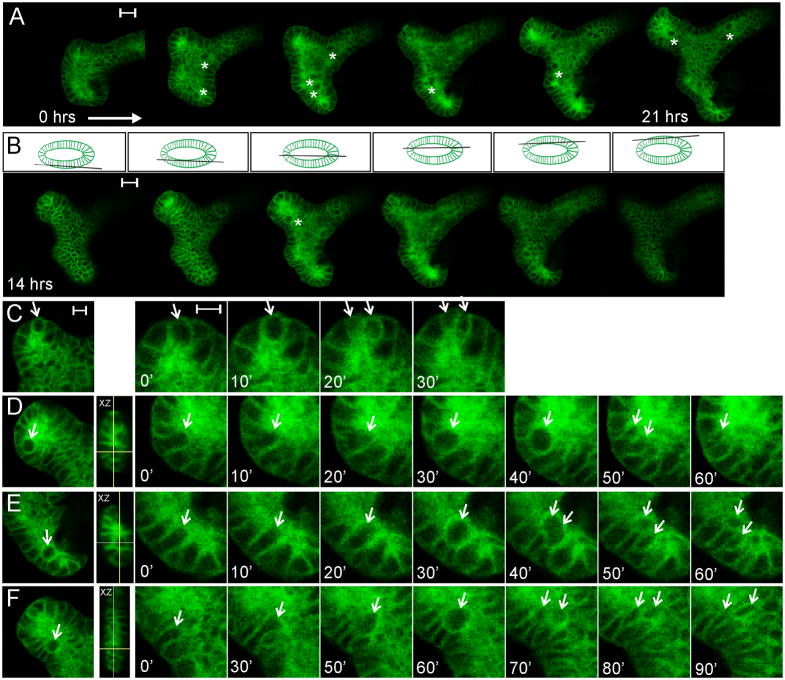
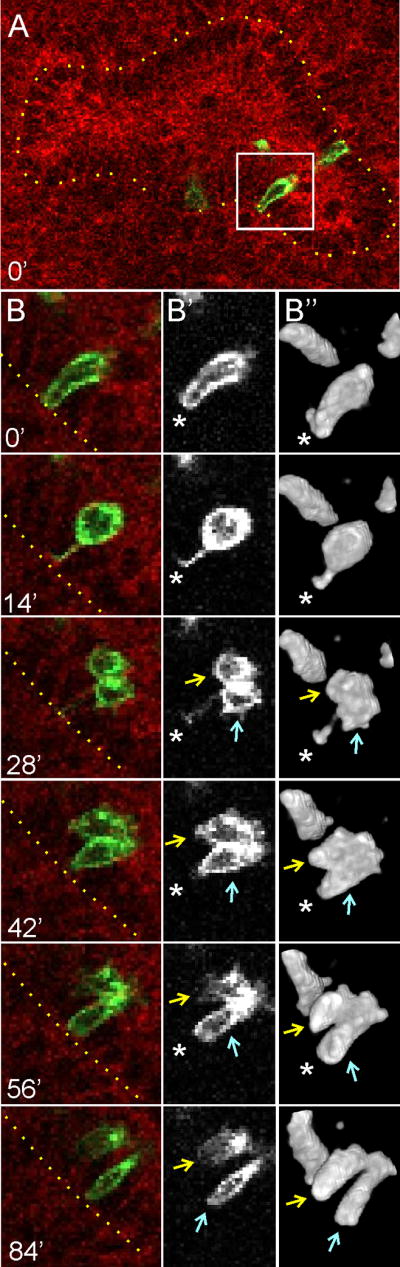
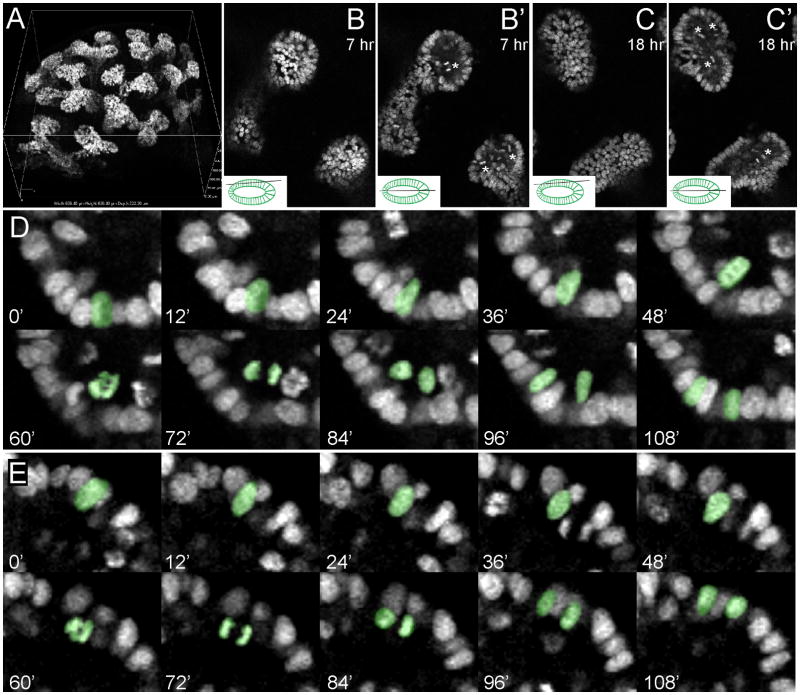
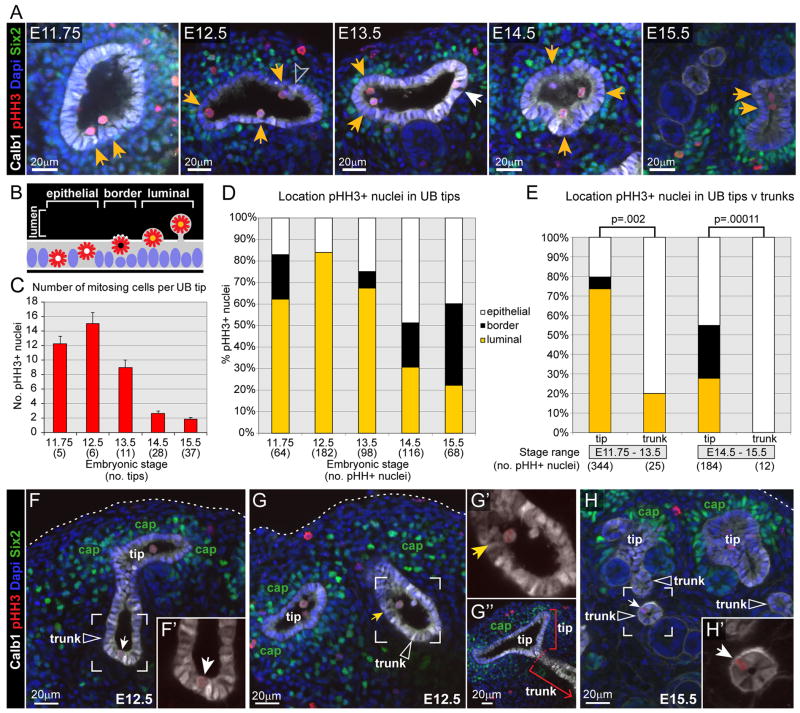
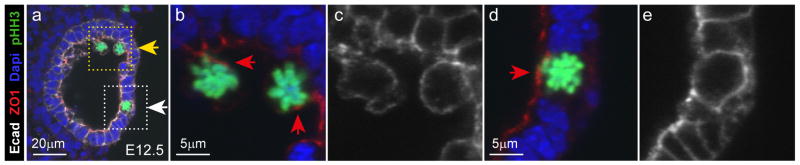
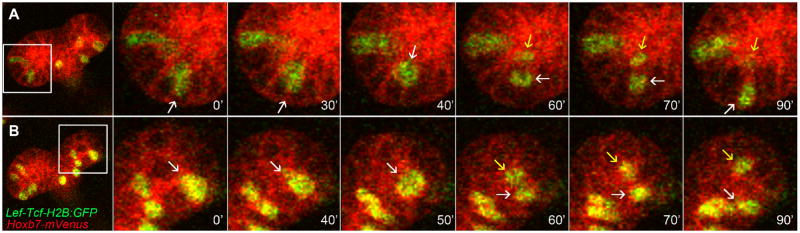
The ureteric bud is an epithelial tube that undergoes branching morphogenesis to form the renal collecting system. Although development of a normal kidney depends on proper ureteric bud morphogenesis, the cellular events underlying this process remain obscure. Here, we used time-lapse microscopy together with several genetic labeling methods to observe ureteric bud cell behaviors in developing mouse kidneys. We observed an unexpected cell behavior in the branching tips of the ureteric bud, which we term "mitosis-associated cell dispersal." Premitotic ureteric tip cells delaminate from the epithelium and divide within the lumen; although one daughter cell retains a basal process, allowing it to reinsert into the epithelium at the site of origin, the other daughter cell reinserts at a position one to three cell diameters away. Given the high rate of cell division in ureteric tips, this cellular behavior causes extensive epithelial cell rearrangements that may contribute to renal branching morphogenesis.


Figures

Figure 1
Figure 1. Time-lapse clonal analysis of labeled ureteric bud cells undergoing mitosis in cultured kidneys
Rare, differentially labeled ureteric bud cells were generated in mouse kidneys by several methods (see Experimental Procedures for details) and followed by time-lapse fluorescence microscopy of organ cultures. Five mitotic events are shown (one each in series A–C, two in series D). The four panels at left show low-magnification views of the kidneys before mitosis of the labeled cell(s). The panels on the right are enlargements, showing the starting position of the pre-mitotic cell (asterisk), movement of the cell away from the basal edge (arrow), cell division and immediate separation of the daughter cells (two arrows), reinsertion of one daughter cell at the site of origin (asterisk) and of the other cell at a distance. In A, the entire ureteric bud expresses the green fluorescent protein myrVenus, while a few cells express the red fluorescent protein tdRFP1. In B and C, the entire ureteric bud expresses eGFP, while a single cell expresses the red fluorescent protein tdTomato. In D, the entire ureteric bud expresses cyan fluorescent protein (weakly visible in the green channel), while a few cells co-express tdTomato and GFP. The image sequences in A–D are also shown in Movie S1.
Figure 2
Figure 2. 4D confocal microscopic analysis of UB mitotic cell behaviors in a kidney culture, using the membrane-targeted fluorescent marker Hoxb7/myrVenus
A, optical sections through the center of a branching ureteric bud ampulla (bisecting the lumen), at six time points between the start (approximately E12.5) and end of the kidney culture (21 hours later). Asterisks indicate large, round mitotic cells visible within the lumen. B, at each time point a complete z-stack (1 μm spacing) was collected. Selected optical sections (at t=14hrs) are shown, starting at the outside of the lower epithelium, going through the center, and ending at the top of the upper epithelium (as indicated by the diagram above each image). For the complete z-stack, see Movie S2. C, a mitotic event in which the dividing cell remains within the epithelium. The image at left shows a UB tip with a large cell, apparently at metaphase; the next four images show enlargements of the dividing cell at 10 minute intervals. D–F, three examples of cell divisions within the UB lumen. The left image in each case shows the location of the mitotic cell at lower magnification. The next image is an XZ projection showing the location of the mitotic cell (crosshairs) within the lumen. The images at right show the sequence of: elongation of the pre-mitotic cell towards the lumen; delamination into the lumen and enlargement of the mitotic cell; cytokinesis; and reinsertion of one daughter cell at the original position in the surface epithelium. In E and F, the second daughter cell has not reinserted at the same position; in D, the second daughter cell is not seen (presumably after reinsertion at a different z-level). (The sequences in C–F are also shown in Movie S3). Scale bars 20 μm (A, B) or 10 μm (C; same for D–F).
Figure 3
Figure 3. 4D confocal microscopic analysis of a dividing UB cell in a kidney culture, using dual-colored, membrane-targeted fluorescent markers
A, optical section through a branching ureteric bud ampulla (at a z-level bisecting the lumen) in a mTmG/+, Ret-CreERT2/+ kidney. The kidney was explanted at E12.5, treated with 4-OH tamoxifen, and cultured overnight before confocal images stacks (0.75 μm spacing) were collected at 14 min intervals. All cells express the membrane-targeted red fluorescent protein mTomato, except for rare recombinant clones in the UB tips that switch to express the membrane-targeted green fluorescent protein mGFP. The yellow dotted line in A and B indicates the basal surface of the UB ampulla, and the white box highlights an mGFP-positive UB cell about to undergo mitosis. B, B′ and B″, six successive stages of UB cell delamination, division and reinsertion. B, red/green merge; B′, mGFP channel only, B″ 3D rendering of mGFP channel (the 3D rendering shows additional labeled cells not visible in the optical sections of B and B′. At 0′, the pre-mitotic cell has elongated into the lumen, but retains extensive contact with the basal surface (asterisk); at 14′, the cell has rounded and retains only a thin membranous process connecting it to the basal surface (asterisk); at 28′, cytokinesis has begun (arrows) and only the lower cell has apparently inherited the basal process; at 42′ – 56′, the tethered cell (blue arrow) reinserts at the original position in the surface epithelium (asterisk); by 84′, the two daughter cells have reinserted into the epithelium at separate sites, but retain an apical connection. This movie terminated before the two daughter cells completed cytokinesis, but other examples (e.g., Figure 1, Figure S1) show that cytokinesis is typically complete within 1–3 hours of mitosis. A time-lapse sequence of the 3D rendered cell division in B″ is shown in Movie S4, and a similar analysis of a second dividing UB tip cell is shown in Figure S1.
Figure 4
Figure 4. 4D analysis of mitoses during ureteric bud branching, using a nuclear fluorescent label
A, 3D rendering of an E12.5 TcfLEF-H2BGFP transgenic kidney, from a confocal image stack. Note the expression of H2BGFP only in the ureteric bud cells, and not in the surrounding mesenchymal cells. B, B′, C, C′, optical sections from an 18 hour culture of an E12.5 TcfLEF-H2BGFP transgenic kidney. B and C are optical sections at the level of the surface epithelium, while B′ and C′ are optical sections at a deeper level that bisects the UB lumen and the lateral edges of the epithelium (see inset diagrams). Asterisks in B′ and C′ indicate mitotic figures visible only at the level of the lumen. Complete 18 hr time-lapse movies, at the z-levels shown in B and C, are provided in Movie S6. A 3D image sequence showing the overall branching of the UB is provided in Movie S5. D–G, sequences of optical sections (at 12 minute intervals) in which mitotic events are visible. The pseudocolored nuclei in D and E first move in a luminal direction (0′ – 48′), then divide (60′ – 72′), then the daughter nuclei then reinsert in the surface epithelium at separate positions (84 – 108 min). The image sequences in D and E are also provided as Movie S7. See also Figure S2.
Figure 5
Figure 5. 3D confocal microscopic analysis of mitotic cells in ureteric tips vs. trunks in vivo
Whole mouse kidneys at stages from E11.75 to E15.5 were stained with markers for ureteric bud epithelium (anti-Calbindin1, white), mitotic cells (anti-pHH3, red), cap mesenchyme cells (anti-GFP to detect Six2GFP, green) and all nuclei (DAPI, blue), and the outer portion of each kidney (containing mostly tips and portions of the adjacent trunks) was examined by confocal microscopy. A–D, locations of mitotic cells in UB tips. A, representative optical sections through a ureteric tip at the indicated stages. Yellow arrows indicate pHH3+ cells located within the lumen (as diagrammed in B), and the white arrow indicates a pHH3+ cell within the epithelium at E13.5. See Figure S3 for examples of each type of pHH3+ cell diagrammed in B. Grey arrowhead in E12.5 indicates a Calbindin1+, pHH3- cell within the lumen. C, number of pHH3+ cells per ureteric tip (error bars indicate standard error of the mean). D, percentage of pHH3+ tip cells located within the lumen (yellow bars), at the lumen-epithelial border (black bars), or within the epithelium (white bars). E, comparison of pHH3+ cell locations in UB tips vs. trunks. Because of the rarity of mitotic cells in UB trunks, for this comparison the data were pooled into two groups: early (E11.75–E13.5) or later (E14.5–E15.5) stages. No pHH3+ cells were identified at the lumen-epithelial border in trunks. A Fisher’s exact test of independence showed statistically significant differences in the distribution of pHH3+ nuclei between tip and trunk across the three locations (lumen – yellow bars, lumen-epithelial border – black bars and epithelium – white bars), at both stage ranges (p values are shown). F–H, Examples of mitotic cells in UB trunks (indicated by open white arrowheads), which were distinguished from tips using 3D structural morphology and by the absence of adjacent Six2+ cap mesenchyme (labeled “cap” in green). The outer edge of the kidney is indicated by dotted white lines. F and G, E12.5 kidneys. F and F′ show an epithelial pHH3+ trunk cell (white arrows), and G and G′ a luminal pHH3+ trunk cell (yellow arrows). G″ shows the terminal end of the trunk highlighted in G and G′, but in a different optical section where the dotted red line indicates the boundary between “tip” and “trunk”. H and H′ show an example of a pHH3+ cell within the trunk epithelium at E15.5. 3–4 kidneys samples were examined at each stage. See also Figures S3 and S4 (for rendering and cell counting methods, and measurement of ureteric tip lumen volumes).
Figure 6
Figure 6. Mitotic cells in the ureteric tip lumen retain E-cadherin and ZO-1 expression
A, optical section of E12.5 mouse kidney fluorescently labeled with antibodies for E-cadherin (white), ZO-1 (red), pHH3 (green) and cell nuclei (DAPI, blue). Two of the pHH3+ cells are located in the lumen (yellow arrow) and one is within the epithelium (white arrow). B and C, enlargements of the yellow boxed area in A, showing that ZO-1 expression is localized to a specific subdomain (red arrows in b) on the E-cadherin labeled surface (C) of the two luminal pHH3+ tip cells. D and E, enlargement of the epithelial mitotic tip cell (white boxed area in a) shows that it expresses ZO-1 on its apical surface, in the same pattern as the non-mitotic (pHH3-) tip cells adjacent to it within the epithelium. See also Figure S5, and Figure S6, which shows additional examples.
Figure 7
Figure 7. Mitotic cell dispersion occurs in E17.5 ureteric tips
An E17.5 kidney expressing the membrane marker Hoxb7/myr-Venus in all UB cells, and with mosaic expression of LEF/Tcf:H2B-GFP in a few UB tip cells, was cultured and imaged by confocal microscopy. The myr-Venus and H2B-GFP signals were separated by spectral imaging and linear unmixing, and myr-Venus was pseudo-colored red. The cell indicated by an arrow at 0 minutes (0′) divides at 60′, its daughters immediately separate (arrows), and they remain 1–2 cells distant at 90′(arrows).

Comment in

References

    1. Affolter M, Zeller R, Caussinus E. Tissue remodelling through branching morphogenesis. Nat Rev Mol Cell Biol. 2009;10:831–842. - PubMed
    1. Al-Awqati Q, Goldberg MR. Architectural patterns in branching morphogenesis in the kidney. Kidney International. 1998;54:1832–1842. - PubMed
    1. Andrew DJ, Ewald AJ. Morphogenesis of epithelial tubes: Insights into tube formation, elongation, and elaboration. Dev Biol. 2010;341:34–55. - PMC - PubMed
    1. Baena-Lopez LA, Baonza A, Garcia-Bellido A. The orientation of cell divisions determines the shape of Drosophila organs. Curr Biol. 2005;15:1640–1644. - PubMed
    1. Baker J, Garrod D. Epithelial cells retain junctions during mitosis. J Cell Sci. 1993;104(Pt 2):415–425. - PubMed

Publication types