. 2013 Dec 1;191(11):5583-93.
doi: 10.4049/jimmunol.1202278. Epub 2013 Nov 1.

Enhancing T lineage production in aged mice: a novel function of Foxn1 in the bone marrow niche

Affiliations

Enhancing T lineage production in aged mice: a novel function of Foxn1 in the bone marrow niche

Erin C Zook et al. J Immunol. .

Abstract

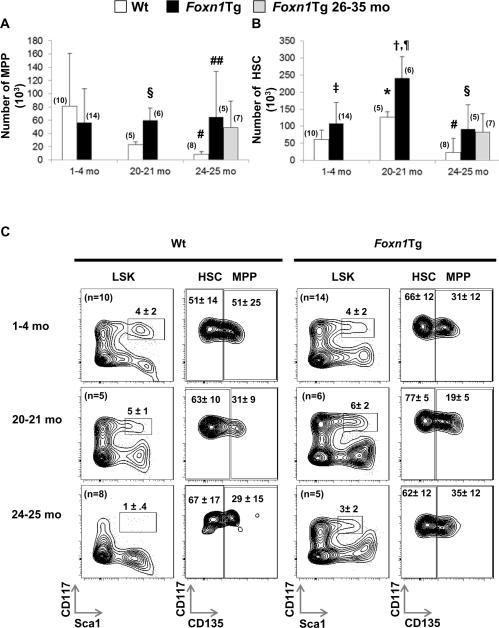
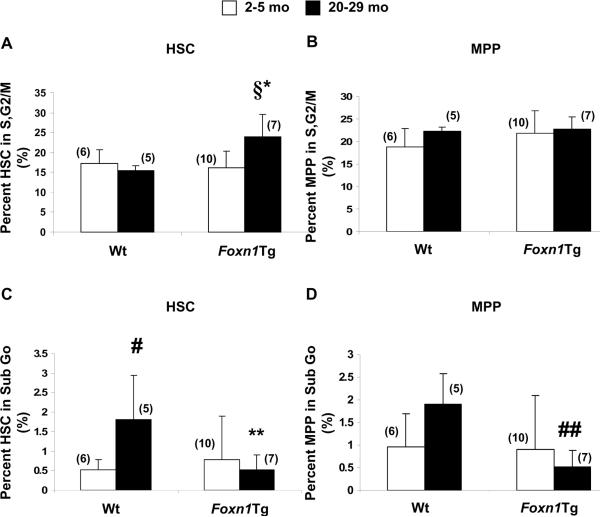
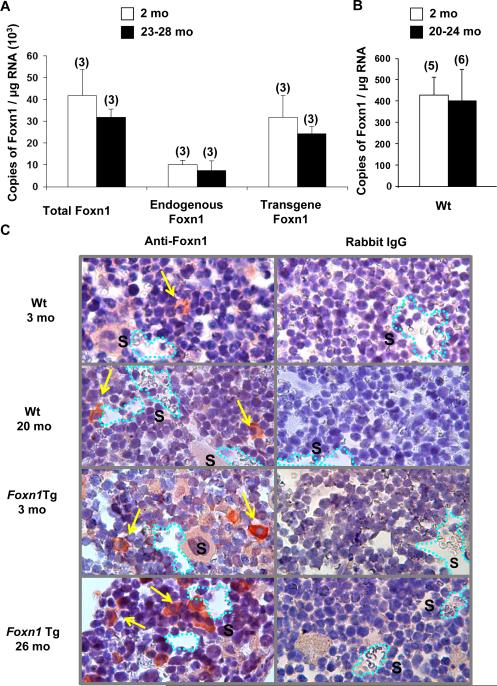
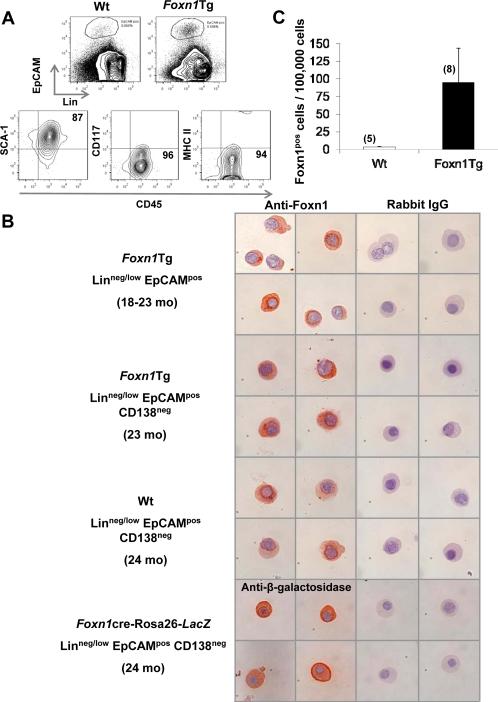
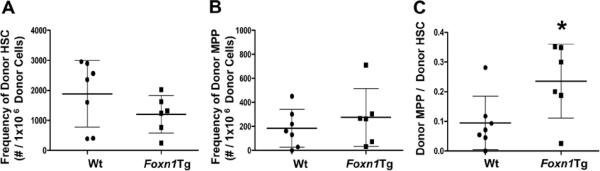
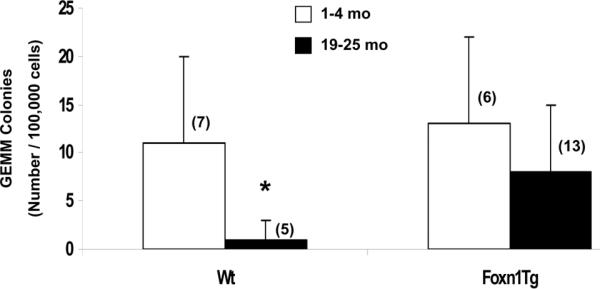
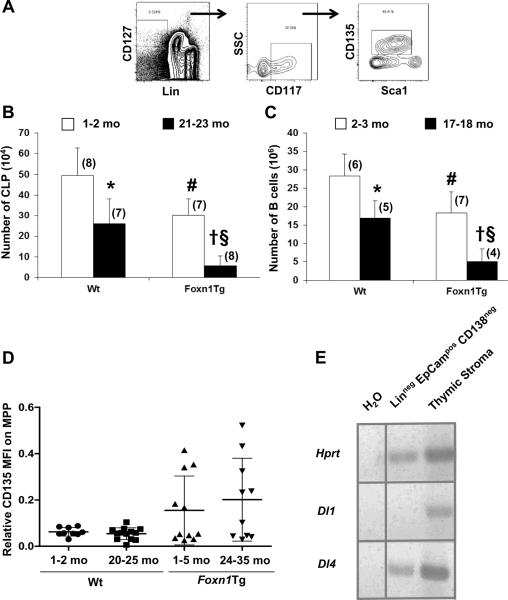
Foxn1 is essential for thymic organogenesis and T lymphopoiesis. Whereas reduced Foxn1 expression results in a decline in T lymphopoiesis, overexpression of Foxn1 in the thymus of a transgenic mouse model (Foxn1Tg) attenuates the age-associated decline in T lymphopoiesis. T lymphopoiesis begins with early T cell progenitors (ETP), derived from multipotent progenitors (MPP) in the bone marrow (BM). A decline in MPP and ETP numbers with age is thought to contribute to reduced T lymphopoiesis. Previously, we showed that reduced ETP number with age is attenuated in Foxn1 transgenic (Tg); whether the effect is initiated in the BM with MPP is not known. In this study, we report that Foxn1 is expressed in wild-type BM and overexpressed in Foxn1Tg. With age, the number of MPP in Foxn1Tg was not reduced, and Foxn1Tg also have a larger pool of hematopoietic stem cells. Furthermore, the Foxn1Tg BM is more efficient in generating MPP. In contrast to MPP, common lymphoid progenitors and B lineage cell numbers were significantly lower in both young and aged Foxn1Tg compared with wild type. We identified a novel population of lineage(neg/low), CD45(pos) EpCAM(pos), SCA1(pos), CD117(neg), CD138(neg), MHCII(neg) cells as Foxn1-expressing BM cells that also express Delta-like 4. Thus, Foxn1 affects both T lymphopoiesis and hematopoiesis, and the Foxn1 BM niche may function in skewing MPP development toward T lineage progenitors.


Figures

Figure 1
Figure 1. Changes in HSC and MPP number with age in Wt and Foxn1Tg mice
One to two million (1-2 × 10⁶) BM nucleated cells from Wt and Foxn1Tg were analyzed using flow cytometry to determine percentages which were then used to calculate the total number of MPP and HSC per two tibias and two femurs. HSC were defined as Linneg Sca1pos CD117pos CD135neg and MPP as Linneg Sca1pos CD117pos CD135pos. A) Total number of MPP in Wt and Foxn1Tg from three age groups. P values were from t-test; #p<0.001 Wt 24-25 mo vs. Wt 1-4 mo; §p=0.002 Wt 20-21 mo vs. Foxn1Tg 20-21 mo; ##p=0.03 Foxn1Tg 24-25 mo vs. Wt 24-25 mo. B) Total number of HSC in Wt and Foxn1Tg; *p=0.004 Wt 20-21 mo vs. Wt 1-2 mo; #p=0.036 Wt 24-25 mo vs. Wt 1-4 mo; p=0.036 Foxn1Tg 1-4 mo vs. Wt 1-4 mo; p<0.001 Foxn1Tg 20-21 mo vs. Foxn1Tg 1-4 mo; p=0.01 Foxn1Tg 20-21 mo vs. Wt 20-21 mo; §p=0.01 Foxn1Tg 24-25 mo vs. Wt 24-25 mo. C) Representative flow cytometry profiles showing changes with age in the frequencies of LSK in Wt and Foxn1Tg. LSK cells were identified as Linneg Sca1pos and CD117pos. Numbers represent the average plus or minus SD. Numbers in parenthesis denote the number of mice.
Figure 2
Figure 2. Changes in cell cycle activity in HSC and MPP with age
FACS-sorted HSC and MPP were analyzed for cell cycle activity using propidium iodine. A, B) Percentages of HSC and MPP in S,G2/M. P values were from t-test; §p=0.005 Foxn1Tg 20-29 mo vs. Foxn1Tg 2-5 mo; *p=0.001 Foxn1Tg 20-29 mo vs. Wt 20 mo. C, D) Percentages of HSC and MPP in sub G0. #p=0.04 Wt 20 mo vs. Wt 2 mo; **p=0.03 Foxn1Tg 20-29 mo vs. Wt 20 mo; ##p=0.005 Foxn1Tg 20-29 mo vs. Wt 20 mo. Numbers in parentheses denote the number of mice in each age group. Error bars are SD.
Figure 3
Figure 3. Expression of Foxn1 in the bone marrow
Nucleated BM cells were used to prepared total RNA and cDNA synthesis for quantitative RT-PCR analysis. Data are presented as copy number of transcripts/μg of total RNA extrapolated from a standard curve (10-100,000 copies/μL). All samples were run in triplicate. A) Expression of endogenous and transgene Foxn1 in Foxn1Tg 2 mo and 23-28 mo. Specific primer sets that detect only transgene transcripts or both forms of transcript were used to calculate endogenous Foxn1 expression levels. B) Expression of Foxn1 in Wt BM 2 mo and 20-24 mo. Numbers in parenthesis denote the number of mice in each age group. Error bars are SD. C) Foxn1 expressing cells in the BM as determined by immunohistochemistry assay. Sternums from Wt and Foxn1Tg mice were fixed, embedded in paraffin blocks, and sectioned at 5 μm. Antigen retrieval was performed on rehydrated tissue sections prior to staining with either rabbit anti-mouse Foxn1 or rabbit IgG at 2μg/ml. Primary antibodies were incubated overnight at 4°C. Dako Universal LSAB biotinylated antibody cocktail t or Donkey anti-rabbit biotin (6 μg/ml) followed by streptavidin-HRP was used for detection of primary antibody. Sections were developed with AEC for 1.5 minutes and counterstained with hematoxylin. Pictures were taken using a Leitz Diaplan microscope with Retiga 2000R camera. Arrows point to Foxn1 positive cells. S denotes sinusoid (dashed lines).
Figure 4
Figure 4. Phenotypic characterization of Foxn1 expressing BM cells and their frequencies in Wt and Foxn1Tg mice
A) Total BM cells were analyzed by flow cytometry; the gating of Linneg/low EpCAMpos BM cells in 3-4 mo and 18-23 mo Wt and Foxn1Tg mice is shown. Foxn1Tg Linneg/low EpCAMpos cells were analyzed for the expression of CD45, Sca1, CD117 and MHCII. Although not shown, expressions of these markers were identical on Wt Linneg/low EpCAMpos cells. B) Electronically sorted Linneg/low EpCAMpos and Linneg/low EpCAMpos CD138neg cells from Wt, Foxn1Tg, or Foxn1cre-Rosa26-lacZ reporter mice were cyto-centrifuged and stained for Foxn1 or anti-E.coli β-galactosidase as described in the Materials and Methods. C) Frequencies of Foxn1pos cells were calculated based on the percentages of positive cells within the Linneg/low EpCAMpos CD138neg population in combination with the frequency of Linneg/low EpCAMpos CD138neg cells determined by flow cytometry and expressed as number of positive cells per 100,000 BM cells. Wt are 24 months and Foxn1Tg are 18-23 months of age. Numbers in parentheses denote the number of mice in each group.
Figure 5
Figure 5. Differences in the ability of aged BM microenvironment of Wt and Foxn1Tg mice to promote the generation of MPP from HSC
LSK were sorted from CD45.1pos mice and 8-16 × 103 cells were transferred into aged Wt or Foxn1Tg hosts via the retro-orbital route. After 10 weeks, the frequencies of donor CD45.1pos HSC (A) and MPP (B) were determined using flow cytometry. C) The ratios of donor MPP to donor HSC were calculated to determine the efficiency of generating MPP from donor HSC (*p=0.03). Each symbol represents the result obtained from one host. Data are from three separate experiments. Error bars are SD.
Figure 6
Figure 6. Generation of CFU-GEMM from Wt and Foxn1Tg in an in vitro BM colony assay
Total BM cells from young (1-4 mo) and age (19-25 mo) Wt and Foxn1Tg were plated in MethoCult GF M3434 methylcellulose (10,000 cells/well, in duplicate) and the number of GEMM colonies generated from HSC were counted after 9 days in culture. Error bars are SD; numbers in parentheses denote the number of animals in each age group. P value are from t-test; *p=0.03, Wt 19=25 mo vs. Wt 1-4 mo.
Figure 7
Figure 7. Changes in the total number of CLP and B lineage cells in Wt and Foxn1Tg with age and expression of Dl4 and Dl1 in Linneg/low EpCAMpos CD138neg BM cells
BM cells from 1-2 and 21-23 months of age Wt and Foxn1Tg mice were analyzed by flow cytometry to determine the number of CLP and B lineage cells. Total numbers were calculated from the frequencies obtained from flow cytometric analysis and total number of nucleated cells obtained from 2 femurs and 2 tibias. A) Flow cytometry gating of CLP. CLP were defined as Linneg CD127pos CD117low Sca1low Flt3pos. B) Number of CLP in young and aged Wt and Foxn1Tg BM. P values were from t-test; *p=0.004 Wt 21-23 mo vs. Wt 1-2 mo; #p=0.005 Foxn1Tg 1-2 mo vs. Wt 1-2 mo; p<0.001 Foxn1Tg 21-23 mo vs. Foxn1Tg 1-2 mo; §p<0.001 Foxn1Tg 21-23 mo vs. Wt 21-23 mo. C) B cells were identified as B220 and/or CD19 expressing cells. P values were from t-test; *p<0.007 Wt 17-18 mo vs. Wt 2-3 mo; #p=0.01 Foxn1Tg 2-3 mo vs. Wt 2-3 mo; p=0.002 Foxn1Tg 17-18 mo vs. Foxn1Tg 2-3 mo; §p=0.004 Foxn1Tg 17-18 mo vs. Wt 17-18 mo. Numbers in parenthesis denotes the number of mice in each age group. Error bars are SD. D) MFI of CD135 (Flt3) on MPP from young and aged Wt and Foxn1Tg mice. The MFI of CD135 was normalized based on MFI of control beads obtained in each experiment. Each symbol represents result from one animal. Statistical significance was determined by two way ANOVA analysis showing significance between Wt and Foxn1Tg (p=0.02). E) Linneg/low EpCAMpos CD138neg BM cells from Foxn1Tg were electronically sorted and total RNA was used to prepare cDNA for RT-PCR. cDNA sample from thymic stroma was used as positive control for Dl1 and Dl4. Primers specific for Hprt were used for quality control of cDNA samples and PCR reactions. Data are representative from 2 independent analyses from two independent sorted samples. Vertical line represents the repositioning of lanes within the same gel.

References

    1. Bleul CC, Corbeaux T, Reuter A, Fisch P, Monting JS, Boehm T. Formation of a functional thymus initiated by a postnatal epithelial progenitor cell. Nature. 2006;441:992–996. - PubMed
    1. Nehls M, Pfeifer D, Schorpp M, Hedrich H, Boehm T. New member of the winged-helix protein family disrupted in mouse and rat nude mutations. Nature. 1994;372:103–107. - PubMed
    1. Ortman CL, Dittmar KA, Witte PL, Le PT. Molecular characterization of the mouse involuted thymus: aberrations in expression of transcription regulators in thymocyte and epithelial compartments. Int. Immunol. 2002;14:813–822. - PubMed
    1. Cheng L, Guo J, Sun L, Fu J, Barnes PF, Metzger D, Chambon P, Oshima RG, Amagai T, Su DM. Postnatal tissue-specific disruption of transcription factor FoxN1 triggers acute thymic atrophy. J. Biol. Chem. 2010;285:5836–5847. - PMC - PubMed
    1. Chen L, Xiao S, Manley NR. Foxn1 is required to maintain the postnatal thymic microenvironment in a dosage-sensitive manner. Blood. 2009;113:567–574. - PMC - PubMed

Publication types

MeSH terms