. 2013 Dec;31(12):1111-8.
doi: 10.1038/nbt.2728. Epub 2013 Nov 3.

Whole-genome haplotype reconstruction using proximity-ligation and shotgun sequencing

Affiliations

Whole-genome haplotype reconstruction using proximity-ligation and shotgun sequencing

Siddarth Selvaraj et al. Nat Biotechnol. 2013 Dec.

Abstract

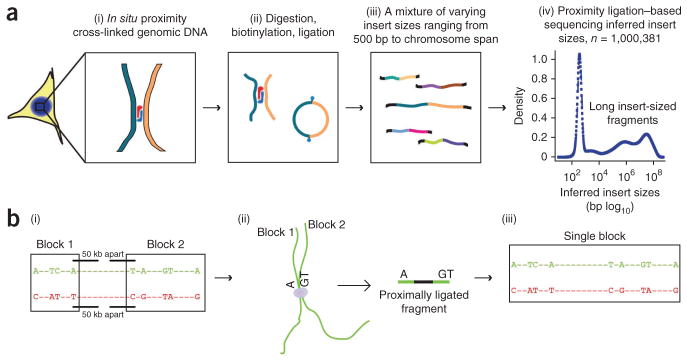
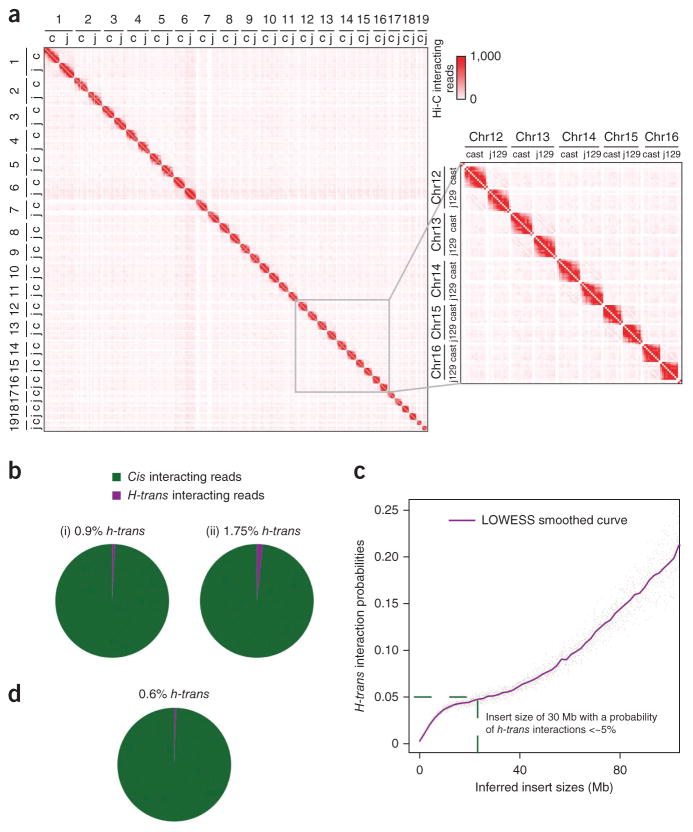
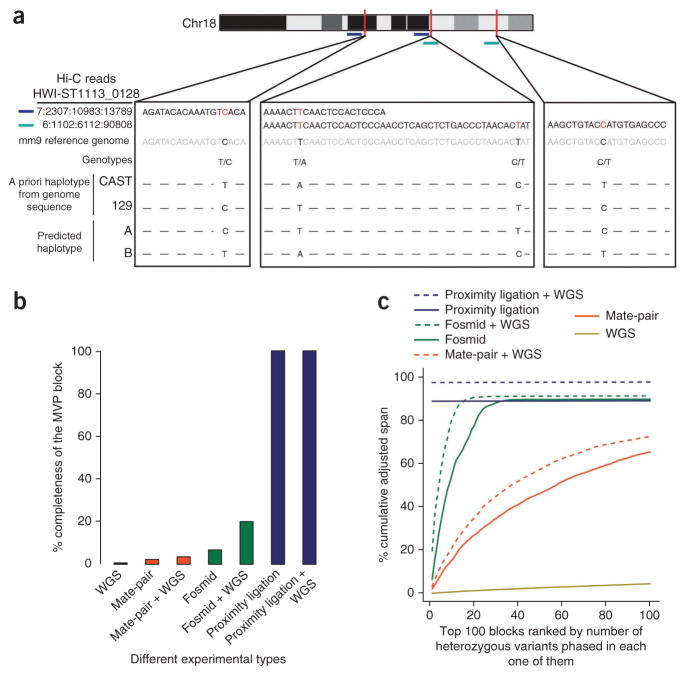
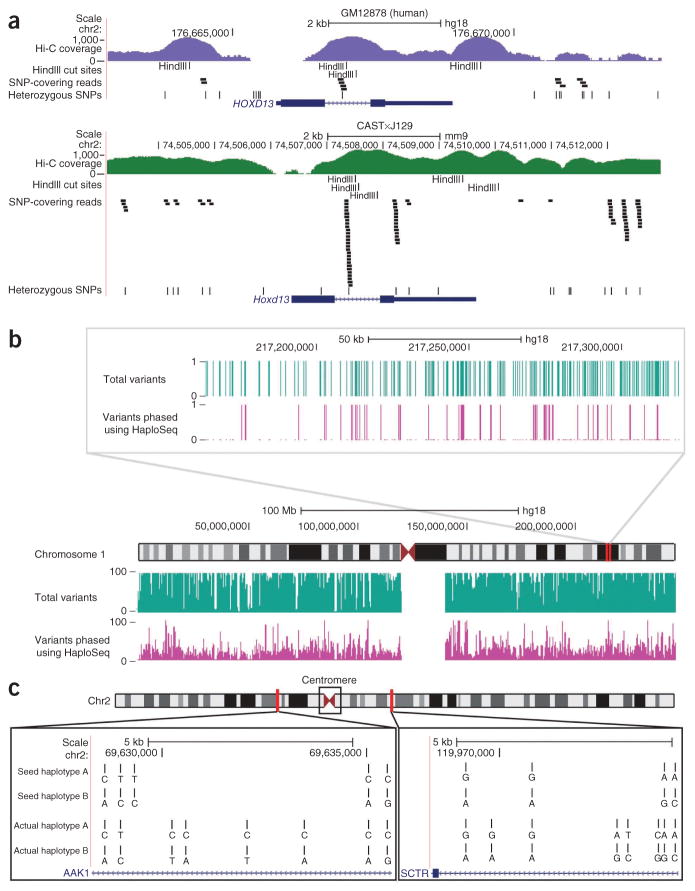
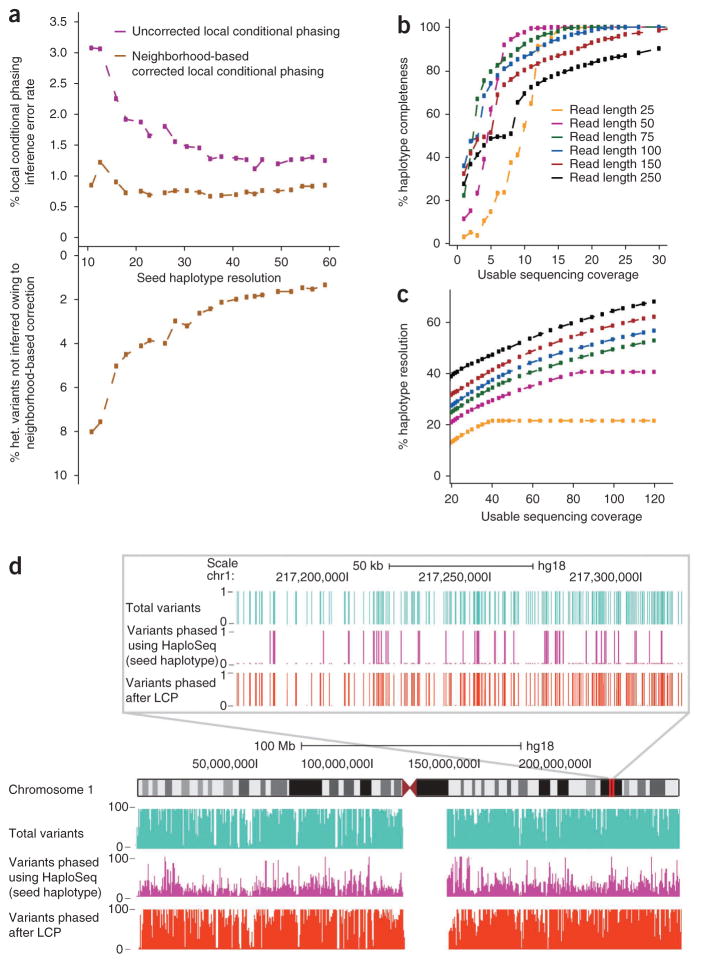
Rapid advances in high-throughput sequencing facilitate variant discovery and genotyping, but linking variants into a single haplotype remains challenging. Here we demonstrate HaploSeq, an approach for assembling chromosome-scale haplotypes by exploiting the existence of 'chromosome territories'. We use proximity ligation and sequencing to show that alleles on homologous chromosomes occupy distinct territories, and therefore this experimental protocol preferentially recovers physically linked DNA variants on a homolog. Computational analysis of such data sets allows for accurate (∼99.5%) reconstruction of chromosome-spanning haplotypes for ∼95% of alleles in hybrid mouse cells with 30× sequencing coverage. To resolve haplotypes for a human genome, which has a low density of variants, we coupled HaploSeq with local conditional phasing to obtain haplotypes for ∼81% of alleles with ∼98% accuracy from just 17× sequencing. Whereas methods based on proximity ligation were originally designed to investigate spatial organization of genomes, our results lend support for their use as a general tool for haplotyping.


Conflict of interest statement

COMPETING FINANCIAL INTERESTS

The authors declare competing financial interests: details are available in the online version of the paper.

Figures

Figure 1
Figure 1
HaploSeq method for reconstructing haplotypes. (a) Proximity-ligation experiment. In brief, cross-linked chromatin are digested and ligated (i,ii). In contrast to other methods (Supplementary Fig. 1a; refs. 41,42), proximity-ligation experiments can capture distal DNA fragments that are spatially close. The ligated DNA fragments are isolated from cells and sequenced (iii). Consequently the Hi-C library contains fragments of different insert sizes (iv). Plot represents random subset of data points taken from Hi-C libraries generated by our laboratory in a lymphoblastoid cell line (GM12878). The x axis is in base pairs (log10 scale). (b) The role of proximity-ligation reads in building chromosome-spanning haplotypes. The green and red sequences represent regions of two homologous chromosomes, where “−” represents no variability and nucleotides represent heterozygous single-nucleotide polymorphisms (SNPs). Heterozygous SNPs and indels can be used to distinguish the homologous chromosomes. Local haplotype blocks (“Block 1” and “Block 2”) can be built from short-insert sequencing reads (i), similar to what occurs in conventional WGS or mate-pair sequencing. Given the distance between variants, these small haplotype blocks remain unphased in relation to each other. Distally located regions in terms of linear sequence can be brought in close proximity in situ (ii). These linkages will be preserved by proximity ligation. The large insert-size proximity-ligation sequencing reads help consolidate smaller haplotype blocks into a single chromosome-spannning haplotype (iii).
Figure 2
Figure 2
Proximity-ligation products are predominantly intrahaplotype. (a) Heat map of whole-genome, long-range, chromatin contact frequencies. Hi-C reads originating from the CAST (“c”) or J129 (“j”) genome were distinguished based on the known haplotype structures of the parental strains. The frequency of interactions between each allele of each chromosome was calculated using 10-Mb bin size. The CAST or J129 allele of each chromosome primarily interacts in cis, confirming that the chromosomes territories seen in Hi-C data occur for individual alleles. Inset shows a magnified view of the CAST and J129 alleles for chromosomes 12 through 16. (b) Chart of intrahaplotype (cis) and interhaplotype (h-trans) interaction frequencies. From a priori haplotype information, we distinguish Hi-C read-pairs as interacting in cis (green) and in h-trans (purple). Plot was generated using data from chromosomes 1–19 in the CAST×J129 system. In (i), we used all intrachromosomal reads, and in (ii), we excluded all intrachromosomal reads that map with an insert size <1kb, as these are probably short contiguous DNA fragments and are therefore very likely to be in cis. Thus, the analysis described in (ii) provides a more conservative estimate of h-trans. Comparing these charts, the frequency of h-trans is at most ~2%. (c) Comparison of the h-trans interaction probability as a function of insert sizes. Plot generated using data from chromosomes 1–19 in CAST×J129 system. LOWESS fit (purple) was performed at 2% smoothing. Below 30 Mb, the probability of a read being an h-trans interaction is ≤5% (green dashed line) at any given insert size. (d) Similar to b, but excluding reads that have inserts >30 megabases. Probability of h-trans is estimated to be ~5% at 30-Mb insert size. Therefore, we use this cutoff as a maximum insert size for subsequent analyses.
Figure 3
Figure 3
HaploSeq allows for accurate, high-resolution, and chromosome-spanning reconstruction of haplotypes. (a) Diagram of Hi-C reads (in blue and green) arising from the 129 alleles that span chromosome 18. These reads are used to link the variants into a single chromosome-spanning haplotype. The sequences of Hi-C reads are shown in black text with the variant locations in red. The sequence of the reference genome is shown in gray. A priori CAST and J129 haplotypes for each genotype at the variant locations are shown along with the predicted haplotype based on the Hi-C data. At these four bases, Hi-C reads match with the known haplotype structure. (b) Comparison of haplotype phasing methods for generating complete haplotypes by simulation. We simulated 75-bp paired-end sequencing data (chromosome 19) of conventional shotgun sequencing (mean = 400, s.d. = 100), mate pair (mean = 4,500, s.d. = 200) and fosmids (mean = 35,000, s.d. = 2,500) at 20× coverage. The first read was randomly placed in the genome, the second read was chosen based on the above-mentioned normal distribution parameters. We subsampled the CAST×J129 data to generate 20× Hi-C fragments that were used for HaploSeq analysis. The y axis represents the span of MVP block as a function of phasable span of chromosome 19. We also combined 20× sequencing coverage for each method with 20× conventional WGS data for a total of 40× coverage to compare methods at a higher coverage. (c) Analysis of the adjusted span (AS) of the haplotype phasing. The AS is defined as the product of span and fraction of heterozygous variants phased in that block. Haplotype blocks were ranked by number of heterozygous variants phased in each block (x axis is ranking) and the cumulative AS over the whole chromosome is represented on the y axis.
Figure 4
Figure 4
Haplotype reconstruction in human GM12878 cells using HaploSeq. (a) The differences in variant frequency between mice (CAST×J129) and humans (GM12878) over the Hoxd13/HOXD13 gene. Also shown in the Hi-C read coverage (log10 scale) over these loci. Hi-C reads are more likely to contain variants in the high SNP density (mouse) case (shown as “SNP-covering reads”). This in turn allows these variants to be more readily connected to the MVP block. In the low variant density scenario (human), this is not the case, and as a result there are “gaps” where variants remain unphased relative to the MVP block. (b) UCSC Genome browser shot illustrating all variants (green track) and phased variants by HaploSeq (purple track) in chromosome 1. The track displays the number of heterozygous variants in each category and demonstrates that only a fraction of variants are phased (low resolution), owing to low variant density in humans. Top panel, a zoom-in of the browser, showing a binary value for presence (value 1) and absence of a variant (value 0) in that category. A value of 0 in the phased variant track represents unphased variants or “gaps,” whereas a value of 1 represents the group of variants that are part of the MVP block. (c) Hi-C–generated seed haplotypes span the centromere of metacentric chromosomes. Shown are two regions on either side of the centromere of chromosome 2. The two Hi-C generated seed haplotypes are arbitrarily designated as “A” and “B.” The actual haplotypes of the GM12878 individual learned from trio sequencing are shown below designated arbitrarily as “A” and “B.” The Hi-C–generated seed haplotypes match the actual haplotypes on both sides of the centromere. Some variants in the actual haplotype remain unphased, thus contributing to the “gaps” in the seed haplotype. In addition, the actual haplotypes based on trio sequencing may not contain all of the phased variants from reference . Therefore, the seed haplotype contains some phased variants not in the trio-phased haplotype (see the third variant in the AAK1 region for example).
Figure 5
Figure 5
HaploSeq analysis coupled with local conditional phasing permits high-resolution haplotype reconstruction in humans. (a) Local conditional phasing. The x axis is the chromosome span seed haplotypes resolution generated by simulation. The top panel shows the error rates of local conditional phasing using both an uncorrected (purple) and neighborhood corrected phasing (gold, window size = 3). Because of neighborhood correction, some variants cannot be locally inferred. The bottom panel shows the percentage of variants that remain unphased due to neighborhood correction as a function of resolution. All simulations are done using GM12878 chromosome 1. (b) Chromosome-spanning seed haplotype (MVP block) at varying parameters of read length and coverage. All simulations are done in GM12878 chromosome 1. (c) Different combinations of read length and coverage generate high-resolution seed haplotypes. Resolution metric depends on percentage of completeness. For example, for 250 bp reads at 30× coverage, resolution is 45% of the 90% variants spanned in haplotype. All simulations are done in GM12878 chromosome 1. (d) UCSC genome browser shot analogous to Figure 4b, illustrating phasing by local conditional phasing (LCP).

Comment in

References

    1. Wheeler DA, et al. The complete genome of an individual by massively parallel DNA sequencing. Nature. 2008;452:872–876. - PubMed
    1. Pushkarev D, Neff NF, Quake SR. Single-molecule sequencing of an individual human genome. Nat Biotechnol. 2009;27:847–850. - PMC - PubMed
    1. Kitzman JO, et al. Noninvasive whole-genome sequencing of a human fetus. Sci Transl Med. 2012;4:137ra76. - PMC - PubMed
    1. Levy S, et al. The diploid genome sequence of an individual human. PLoS Biol. 2007;5:e254. - PMC - PubMed
    1. Crawford DC, Nickerson DA. Definition and clinical importance of haplotypes. Annu Rev Med. 2005;56:303–320. - PubMed

Publication types

Associated data