. 2013 Dec;31(12):1119-25.
doi: 10.1038/nbt.2727. Epub 2013 Nov 3.

Chromosome-scale scaffolding of de novo genome assemblies based on chromatin interactions

Affiliations

Chromosome-scale scaffolding of de novo genome assemblies based on chromatin interactions

Joshua N Burton et al. Nat Biotechnol. 2013 Dec.

Abstract

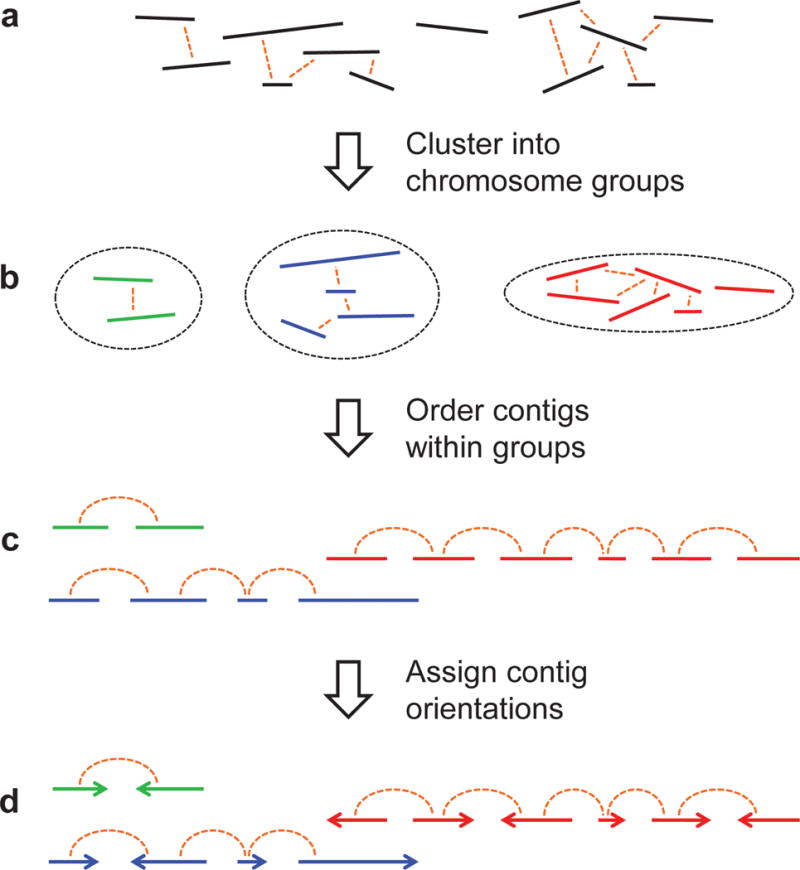
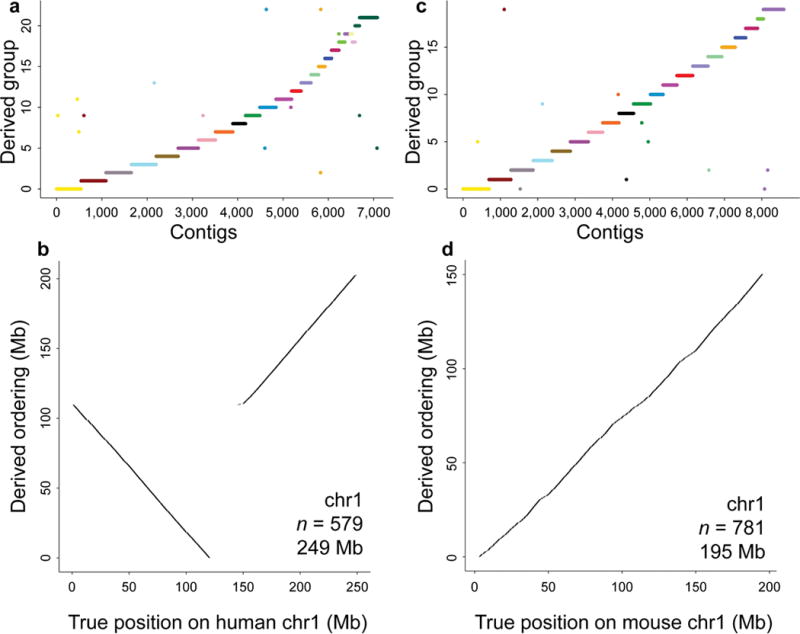
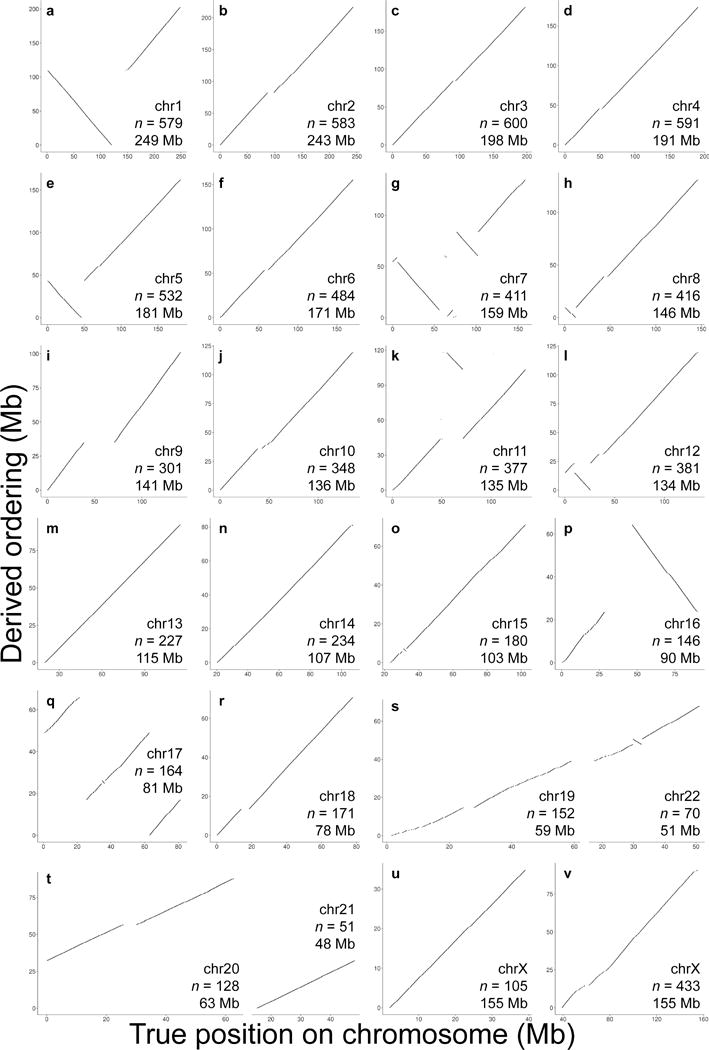
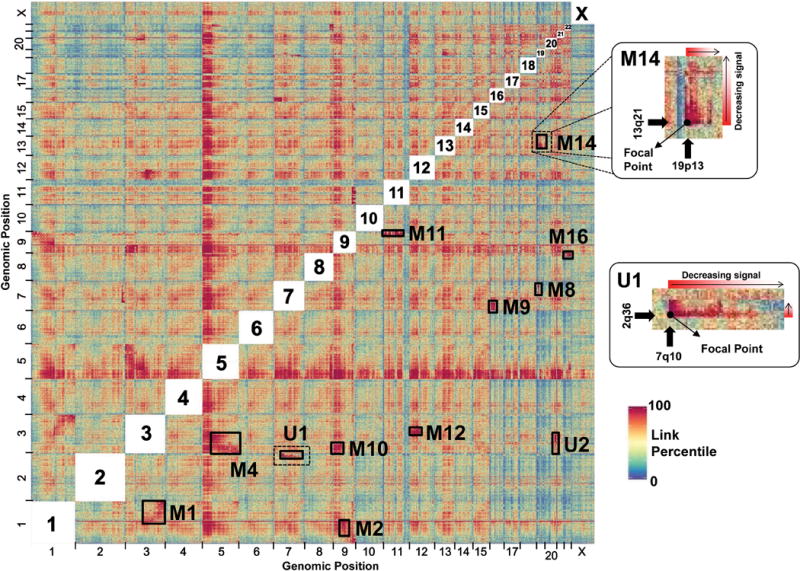
Genomes assembled de novo from short reads are highly fragmented relative to the finished chromosomes of Homo sapiens and key model organisms generated by the Human Genome Project. To address this problem, we need scalable, cost-effective methods to obtain assemblies with chromosome-scale contiguity. Here we show that genome-wide chromatin interaction data sets, such as those generated by Hi-C, are a rich source of long-range information for assigning, ordering and orienting genomic sequences to chromosomes, including across centromeres. To exploit this finding, we developed an algorithm that uses Hi-C data for ultra-long-range scaffolding of de novo genome assemblies. We demonstrate the approach by combining shotgun fragment and short jump mate-pair sequences with Hi-C data to generate chromosome-scale de novo assemblies of the human, mouse and Drosophila genomes, achieving--for the human genome--98% accuracy in assigning scaffolds to chromosome groups and 99% accuracy in ordering and orienting scaffolds within chromosome groups. Hi-C data can also be used to validate chromosomal translocations in cancer genomes.


Conflict of interest statement

Competing Financial Interests

The authors are in the process of filing a provisional patent application on this method. J.S. is a member of the scientific advisory board or serves as a consultant for Adaptive Biotechnologies, Ariosa Diagnostics, Stratos Genomics, GenePeeks, Gen9, Good Start Genetics and Rubicon Genomics.

Figures

Figure 1
Figure 1
A schematic of the LACHESIS scaffolding method. (a) The input consists of a set of contigs (or scaffolds) from a draft assembly and a set of genome-wide chromosome interaction data, e.g., Hi-C links. (b) Contigs on the same chromosome tend to have more Hi-C links between them, relative to contigs on different chromosomes. LACHESIS exploits this to cluster the contigs into groups that largely correspond to individual chromosomes. (c) Within a chromosome, contigs in close proximity tend to have more links than contigs that are distant. LACHESIS exploits this to order the contigs within each chromosome group. (d) Lastly, LACHESIS uses the exact position of links between adjacent contigs to predict the relative orientation of each contig.
Figure 2
Figure 2
Clustering and ordering mammalian sequences with LACHESIS. (a) The results of LACHESIS clustering on the de novo human assembly. Shown on the x-axis are the 7,083 scaffolds (total length: 2.49 Gb) that are large (≥25 AAGCTT restriction sites) and not repetitive (Hi-C link density less than 2 times average), which LACHESIS uses as informative for clustering. The y-axis shows the 23 groups created by LACHESIS, with the order chosen for the purposes of clarity. The color scheme is the standard SKY (spectral karyotyping) color scheme for human. (b) The results of LACHESIS ordering and orienting of 579 scaffolds within the group from a corresponding to human chromosome 1. On the x-axis is the true position of these scaffolds along human chromosome 1. On the y-axis is the order in which LACHESIS has placed these scaffolds. Also listed in the panel are the chromosome name, the number of scaffolds in the derived ordering and the reference length of this chromosome. (c) The results of LACHESIS clustering on the de novo mouse assembly. Shown on the x-axis are the 8,594 scaffolds (total length: 1.94 Gb) that are large and not repetitive, which LACHESIS uses as informative for clustering. The y-axis shows the 20 groups created by LACHESIS, with the order chosen for the purposes of clarity. The color scheme is as in a. (d) The results of LACHESIS ordering and orienting of 781 scaffolds within the group from c corresponding to mouse chromosome 1. The plotting is as in b.
Figure 3
Figure 3
LACHESIS ordering of scaffolds in a de novo human assembly. (av) The results of LACHESIS ordering and orienting on 22 of the 23 chromosome groups in the de novo human assembly. For each ordering, only the scaffolds on the “dominant chromosome” (the chromosome containing the plurality of aligned sequence) are shown. The exceptions are two groups that correspond to fusions of small chromosomes (19 and 22 (s); 20 and 21 (t)) (see Supplementary Table 2). Within each of these fused groups, the two chromosomes were well separated by ordering (s,t). The X chromosome clustered into two separate groups (u,v). Not shown is one very small chimeric group (length = 6.5 Mb; see Supplementary Fig. 4w). Also listed in each panel are the identity of the dominant chromosome, the number of scaffolds in the derived ordering and the reference length of the dominant chromosome.
Figure 4
Figure 4
Detection of chromosome fusions in HeLa S3 using Hi-C data. Normalized interchromosomal links for a HeLa S3 Hi-C library between megabase windows were derived as described in Online Methods and are represented as an all-by-all heatmap. For visualization purposes, link weights were ranked and converted to a percentile. Previously identified marker chromosomes were identified (M1, M2, M4, M8, M9, M10, M11, M12, M14 and M16) as well as two additional peaks representing previously undescribed marker chromosomes (U1: der(2;7)(q36;q10) and U2: der(3;20)(q25;q10)). Two rearrangements are highlighted (M14 and U1) to demonstrate the signal focal point at the location of the fusion event with asymmetrical signal decay outward in the direction of the sequence contained in the chromosome fusion, thus allowing breakpoint identification as well as orientation.

Comment in

References

    1. International Human Genome Sequencing Consortium. Initial sequencing and analysis of the human genome. Nature. 2001;409:1–62.
    1. International Human Genome Sequencing Consortium. Finishing the euchromatic sequence of the human genome. Nature. 2004;431:931–945. - PubMed
    1. Shendure J, Ji H. Next-generation DNA sequencing. Nature Biotechnology. 2008;26:1–11. - PubMed
    1. Shendure J, Lieberman-Aiden E. The expanding scope of DNA sequencing. Nature Biotechnology. 2012;30:1084–94. - PMC - PubMed
    1. Compeau P, Pevzner P, Tesler G. How to apply de Bruijn graphs to genome assembly. Nature Biotechnology. 2011;29:987–91. - PMC - PubMed

Publication types

Associated data