. 2013 Dec;15(12):1473-85.
doi: 10.1038/ncb2865. Epub 2013 Nov 3.

A CREB3-ARF4 signalling pathway mediates the response to Golgi stress and susceptibility to pathogens

Affiliations

A CREB3-ARF4 signalling pathway mediates the response to Golgi stress and susceptibility to pathogens

Jan H Reiling et al. Nat Cell Biol. 2013 Dec.

Abstract

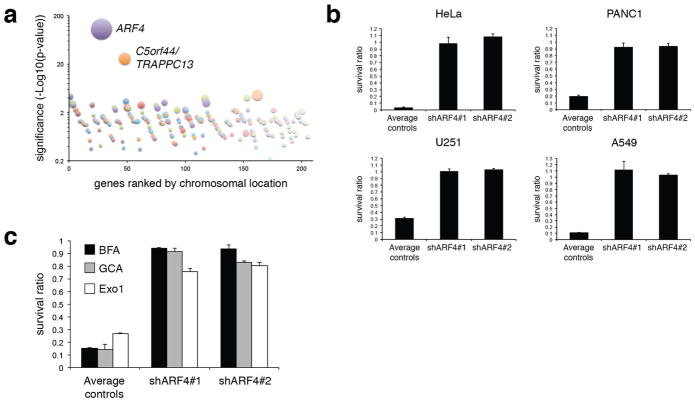
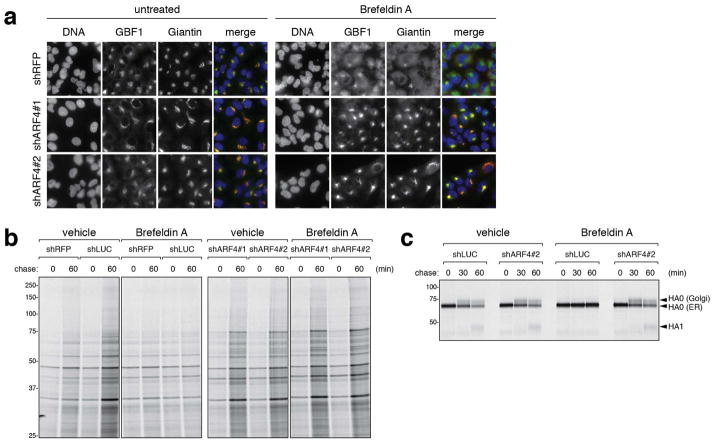
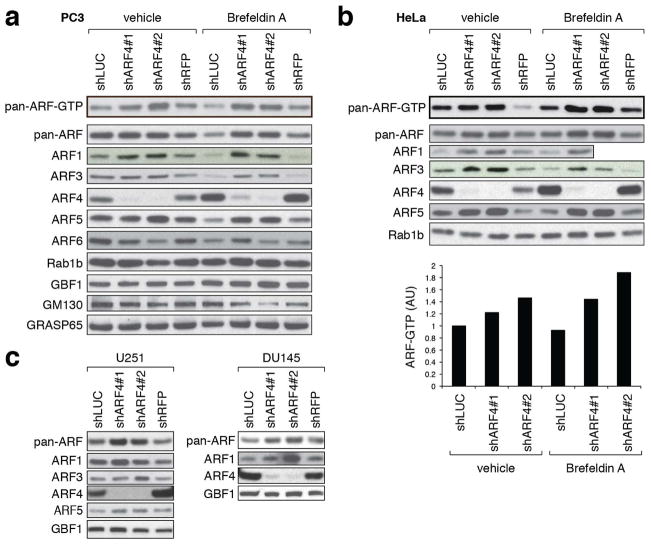
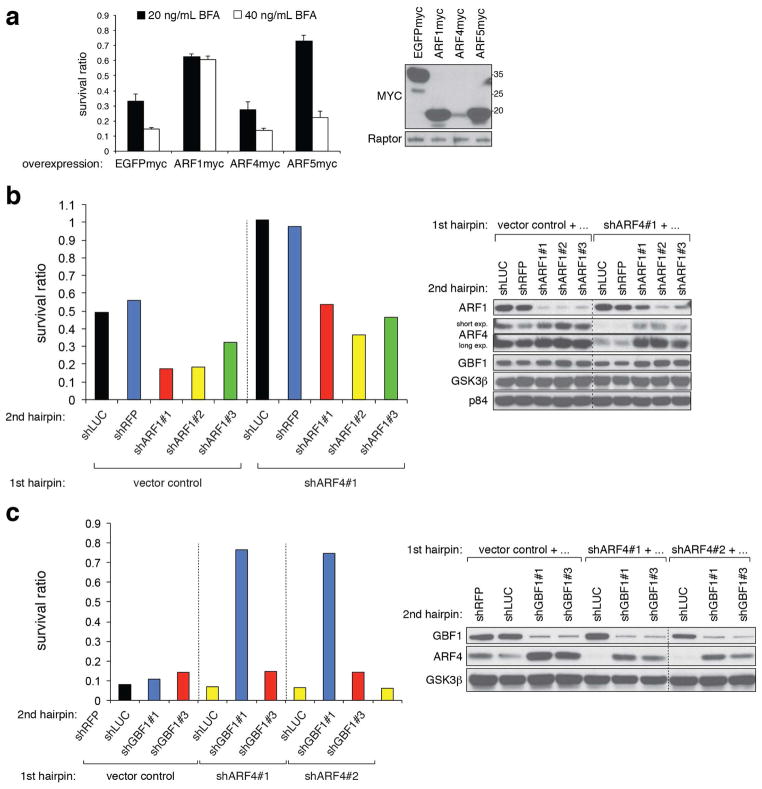
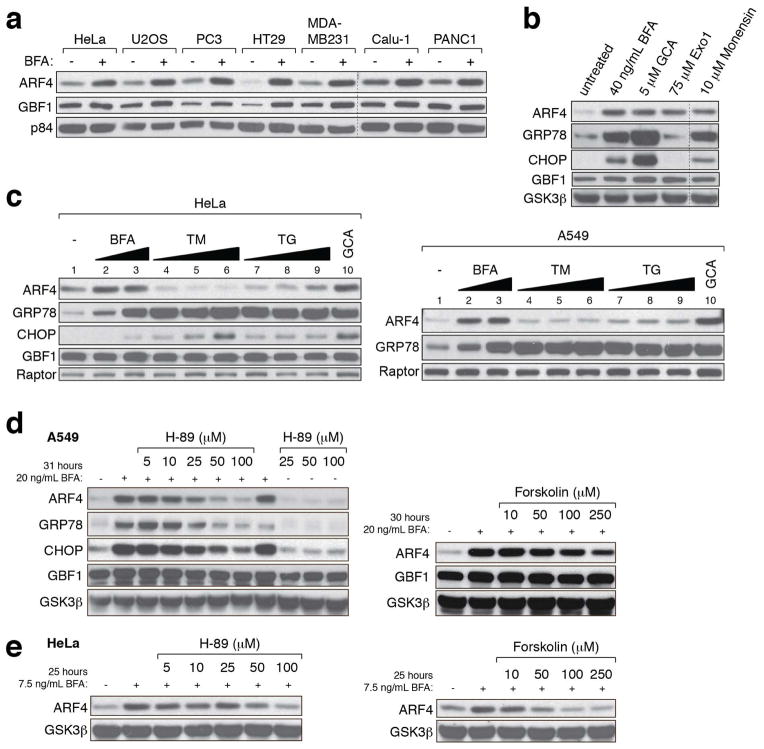
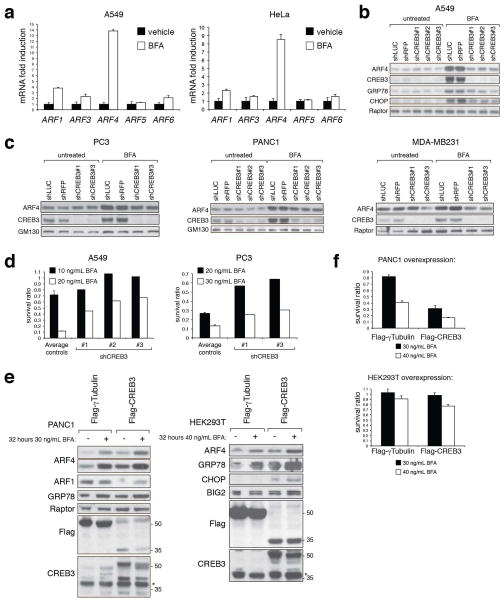
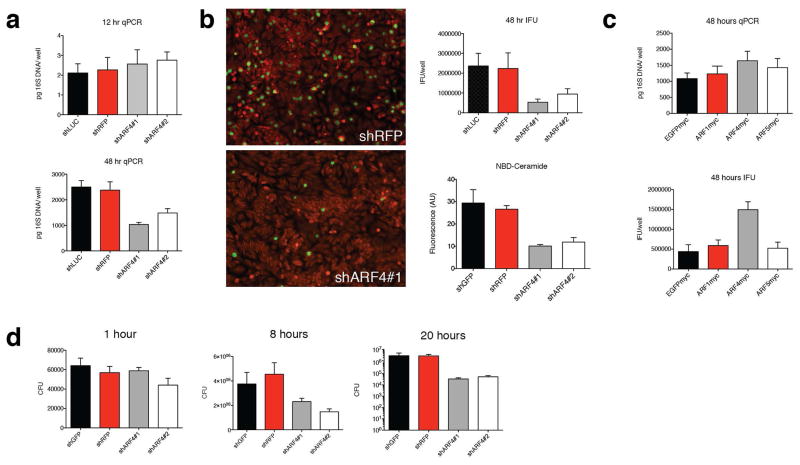
Treatment of cells with brefeldin A (BFA) blocks secretory vesicle transport and causes a collapse of the Golgi apparatus. To gain more insight into the cellular mechanisms mediating BFA toxicity, we conducted a genome-wide haploid genetic screen that led to the identification of the small G protein ADP-ribosylation factor 4 (ARF4). ARF4 depletion preserves viability, Golgi integrity and cargo trafficking in the presence of BFA, and these effects depend on the guanine nucleotide exchange factor GBF1 and other ARF isoforms including ARF1 and ARF5. ARF4 knockdown cells show increased resistance to several human pathogens including Chlamydia trachomatis and Shigella flexneri. Furthermore, ARF4 expression is induced when cells are exposed to several Golgi-disturbing agents and requires the CREB3 (also known as Luman or LZIP) transcription factor, whose downregulation mimics ARF4 loss. Thus, we have uncovered a CREB3-ARF4 signalling cascade that may be part of a Golgi stress response set in motion by stimuli compromising Golgi capacity.


Figures

Figure 1
Figure 1. Loss of ARF4 provides resistance to several Golgi-disrupting agents
(a) Mutagenized KBM7 cells were grown for 3 weeks in the presence of 50 ng/mL (180 nM) BFA after which genomic DNA of the surviving cells was isolated, and the GT insertion sites determined by deep sequencing and alignment to the genome. The number of independent insertions per gene was determined (represented by the circle size) and compared with that of an unselected mutagenized cell population from which enrichment scores (p-values) were derived (y axis). GT insertions were ordered along the x axis based on their chromosomal position. The two genes that were most enriched compared with an untreated control dataset were ARF4 (37 GTs; p<8.39×10−110) and C5orf44/TRAPPC13 (12 GTs; p<7.86×10⁻²⁹). The p-values, corrected for false discovery rate, were calculated using the one-sided Fisher exact test. (b) Viability of several cancer cell lines infected with control or ARF4 hairpins in response to BFA. Survival ratio was calculated by dividing cell numbers of BFA-treated cells by their corresponding counterparts under untreated conditions (with the exception of U251 cells whose viability was measured using the CellTiterGlo (CTG) assay). Shown are the means and S.D. of ARF4 KD and control cells and are examples of two representative experiments. Average controls refers to the averaged mean survival ratio of two to three different control hairpin-infected cell lines (shLUC, shRFP, shGFP) whose survival ratio is shown as the mean and S.E.M. Treatment duration, BFA concentrations and p-values are as follows: HeLa: 3 days 30 ng/mL BFA treatment, p<0.0003 for both ARF4 shRNAs, 5 wells were counted of each genotype and condition; PANC1: 4 days 40 ng/mL BFA treatment; p<0.00009 for both ARF4 shRNAs, 4 wells of each genotype and condition were counted; U251: 3 days 30 ng/mL BFA treatment, p=1.06×10⁻¹⁴ for shARF4#1 and p=5.72×10⁻²³ for shARF4#2, 10 wells were measured; A549: 3 days 40 ng/mL BFA treatment, p<0.005 for both ARF4 shRNAs, 3 wells were counted fore each genotype and condition. The p-values were determined using student’s 2-tailed t-test. (c) Survival ratios of control and ARF4-depleted cells in response to BFA, Exo1 and GCA treatment as determined by counting surviving cells under treated and untreated conditions. Concentrations of compounds used were 20 ng/mL BFA, 2 μM GCA or 75 μM Exo1, treatment duration was 3 days. P-values are as follows (3 wells were analyzed): 2 μM GCA: p<0.0003 for both ARF4 shRNAs; 20 ng/mL BFA: p<0.018 for both ARF4 shRNAs; 75 μM Exo1: p<0.00025 for both ARF4 shRNAs (student’s t-test).
Figure 2
Figure 2. ARF4 depletion preserves Golgi morphology and protein trafficking upon BFA treatment
(a) IF images of one control and two ARF4 KD A549 cell lines reveal that ARF4 function is critical for Golgi dispersal upon BFA treatment as assessed by staining for the Golgi and ERGIC markers GBF1 and Giantin. Cells were treated with 20 ng/mL BFA for 29 hours. Images are representative of three independent experiments. (b) HeLa cells infected with either of two control (shLUC and shRFP) or ARF4 hairpins were metabolically labeled for 4 hours, and the amount of total proteins secreted into the culture media was assessed by SDS-PAGE. In the presence of 50 ng/mL BFA secretory trafficking persists in cells without ARF4 but not in the control cells. The experiment has been repeated twice. (c) Control or ARF4-depleted cells were infected with influenza A virus at low pH. Influenza-derived Hemagglutinin A (HA)-trafficking through the secretory system was analyzed after a pulse of radioactive-labeled Met/Cys followed by a chase with cold Met/Cys. The results show that HA glycan-processing is not disrupted in the presence of BFA in cells without ARF4. HA0 is the full length HA that forms in the ER and trafficks through the Golgi. HA1 refers to HA that has reached the cell surface and is cleaved by Trypsin added to the chase media. The experiment was performed twice. See Methods section for further details.
Figure 3
Figure 3. Compensatory upregulation of other ARF family members in ARF4 knockdown cells
(a–c) Several cancer cell lines were transduced with lentiviral control hairpins or shRNAs against ARF4, and cell lysates were probed with the indicated antibodies. (a, b) Stable hairpin-control or ARF4 KD PC3 (a) or HeLa (b) cells were analyzed for total ARF-GTP levels in the absence or presence of 20 ng/mL BFA (24 hours treatment) using a GST-VHS-GAT pull-down assay. In this assay, increased ARF binding to VHS-GAT, a truncated GGA3 form and ARF-substrate that is bound only when ARFs are GTP-loaded, serves as proxy for ARF activity. A representative example of two independent experiments showing a quantification of ARF-GTP levels in HeLa cells is shown (note that we omitted the shRFP control in the bar graph for this particular analysis. AU= arbitrary units). The corresponding protein lysates for the samples used in (a) and (b) were tested with indicated antibodies. (c) Two additional examples representing two independent experiments (DU145 and U251 cells) showing upregulated (pan-) ARF levels in ARF4-depleted cells.
Figure 4
Figure 4. BFA resistance of ARF4-depleted cells depends on ARF1 and GBF1
(a) Stable overexpression of C-terminally tagged ARF1 or ARF5 but not ARF4 in A549 cells increases viability of BFA-treated cells. Treatment duration was 3 days, and cell viability was assessed by the CTG assay measuring 12 wells of each genotype and condition. At a concentration of 20 ng/mL but not 40 ng/mL BFA ARF4 overproduction slightly sensitized to the drug (p=0.015) despite its weak expression. P-values (for both BFA concentrations) are p<1.8×10⁻¹¹ and p<4×10⁻⁵ for ARF1 and ARF5 overexpression, respectively (student’s t-test). The experiment has been reproduced twice. (b, c) Reducing ARF1 (b) or GBF1 (c) function in ARF4 KD A549 cells using multiple independent shRNAs negates BFA resistance observed in ARF4 single KD cells. Cells were treated for 3 days with 12.5 ng/mL BFA (a) or 20 ng/mL BFA (b), and two wells were counted per condition and DKD combination. Survival was determined by coulter counter measurements. Western blot analysis of co-depleted cells are presented to confirm KD of the indicated proteins. Note the upregulation of ARF4 levels in ARF1- or GBF1-deprived cells.
Figure 5
Figure 5. Golgi stress causes ARF4 upregulation
(a) Several cancer cell lines were cultured with or without 20 ng/mL BFA for 29 hours before cell lysis, and protein extracts were analyzed with the indicated antibodies. The blot is representative of two independent experiments. Note the induction of ARF4 and GBF1 levels in the presence of BFA. (b) A549 cells were left untreated or exposed to 40 ng/mL BFA, 5 μM GCA, 75 μM Exo1 or 10 μM Monensin for 29 hours revealing increased ARF4 expression. The experiment was repeated three times. (c) Immunoblots showing ARF4 and ER stress marker expression of HeLa and A549 cells treated for 29 hours with following compounds and concentrations: lane 1: untreated, lanes 2 and 3 Brefeldin A (BFA; used at 10 ng/mL= 36 nM and 50 ng/mL= 180 nM); lanes 4–6: Tunicamycin (TM; used at 100 ng/mL (119 nM), 500 ng/mL (597 nM) and 2 mg/mL (2.39 μM); lanes 7–9: Thapsigargin (TG; used at 10 nM, 100 nM and 500 nM); lane 10: Golgicide A (GCA; used at 5 μM). Western blots are representative of two independent experiments. (d, e) Co-treatment of A549 or HeLa cells with BFA and increasing amounts of H-89 or Forskolin, two compounds that antagonize BFA-induced Golgi dispersal, mitigates upregulation of ARF4 and UPR parameters. The experiment was repeated twice with qualitatively similar results.
Figure 6
Figure 6. CREB3/Luman mediates ARF4 induction upon Golgi stress
(a) A549 or HeLa cells were vehicle-treated (0.04% ethanol) or treated with 20 ng/mL BFA for 29 hours, and ARF mRNA levels were assessed by quantitative real-time PCR and normalized to 36B4 mRNA expression. RNA of three wells per genotype and condition was extracted, and data points are represented as mRNA fold induction compared with vehicle-treated samples. Error bars denote S.D. values, and p-values are as follows (student’s 2-tailed t-test): p=0.019 and 0.0003 for ARF4, and p=0.0015 and 0.01 for ARF1 (A549 and HeLa, respectively). All other p-values were not significant. (b, c) Lentiviral-mediated KD of CREB3 in A549 (b), PC3, PANC1, or MDA-MB231 (c) in the presence of BFA reduces ARF4 expression relative to control hairpin-infected cells. BFA concentrations used were 20 ng/mL except for PANC1 (40 ng/mL), and treatment durations were 29 hours (A549 cells), 27 hours (PC3), 22 hours (PANC1), or 30 hours (MDA-MB231). Western blots were repeated twice of each cell line. (d) shRNA-mediated CREB3 downregulation increases viability of BFA-treated A549 or PC3 cells in comparison to control cells. N=4 wells for the control hairpins per condition, and n=2 wells for the shCREB3 hairpins. Treatment durations were 3 and 4 days for A549 and PC3 cells, respectively. (e) Stable CREB3 overexpression is sufficient to elevate endogenous ARF4 levels in PANC1 or HEK293T cells. Upon overexpression, two bands could be detected by Western blotting when antibodies against the Flag-epitope or endogenous CREB3 were used. The predominant band detected in most cell lines when probed for endogenous CREB3 is the upper band (approximately 50 kDa, corresponding to the full length form), and a lower band (approximately 35–40 kDa) is occasionally discernable and might represent S1P/S2P-mediated cleavage products. * denotes unspecific band. Western blots are representative of two independent experiments. (f) Increased BFA susceptibility of stable cell lines overexpressing CREB3. P-values for PANC1 cells were p<0.002 for both BFA concentrations (n=4 wells), and treatment duration was 4 days. For HEK239T cells (n=4 wells) p=0.045 and p=0.001 using 30 ng/mL and 40 ng/mL BFA, respectively (student’s 2-tailed t-test). * denotes unspecific band.
Figure 7
Figure 7. ARF4 loss protects against several intracellular pathogens
(a, b) Intracellular replication and infectivity of C. trachomatis is inhibited upon loss of ARF4 in HeLa cells. (a) Quantitative PCR analysis of cells infected with C. trachomatis shows a significant decrease of bacterial genomes present after 48 hours p<0.05 (one-way ANOVA) but not after 12 hours in ARF4 KD cells relative to controls. Four wells were analyzed, and the experiment was performed twice. Bar graphs depict mean values, and error bars correspond to S.D. (b) Representative IF images of wild type HeLa cells infected with C. trachomatis progeny produced from shRFP or ARF4 hairpin-infected cells reveal significant differences in infectivity. C. trachomatis inclusions are represented in green (stained for C. trachomatis major outer membrane protein (MOMP)), and cells were counter-stained with Evans Blue. The right upper panel shows inclusion forming unit (IFU) quantification. Four wells per genotype were quantified, p<0.05 for both shARF4 hairpins (one-way ANOVA). The lower right graph displays a quantification of cellular NBD-ceramide labeling demonstrating a lower fluorescent ceramide content in ARF4-depleted cells relative to control cells (AU= arbitrary units). Cells were pulsed for one hour with NBD-ceramide. Six wells were measured per genotype, p<0.05 (one-way ANOVA) and the experiment was performed twice. Bar graphs depict average values, and error bars correspond to S.D. (c) Increased ARF4 expression enhances growth of C. trachomatis. Infected HeLa cells were analyzed for the presence of C. trachomatis DNA and for inclusion formation 48 hours post-infection. ARF4- but not ARF1- or ARF5-overexpression significantly increased the presence of bacterial genomes and inclusion formation in infected cells compared with control cells (p<0.05 using one-way ANOVA). Two independent experiments for each assay yielding qualitatively similar results were performed analyzing six wells of each genotype. (d) Decreased S. flexneri growth upon ARF depletion. Cells were infected with S. flexneri and treated with Gentamicin. The cells were then lysed at various time points after and dilution plating was used to count the number of bacterial colonies present (CFU=colony forming units). ARF4-depleted cells show less CFUs compared with control hairpin-infected cells (p<0.05 for ARF4 KD hairpins at 8 hours and 20 hours after infection (one-way ANOVA). Results are representative of two independent experiments measuring each time three plates per genotype.

Similar articles

Cited by

References

    1. Chiu VK, et al. Ras signalling on the endoplasmic reticulum and the Golgi. Nat Cell Biol. 2002;4:343–350. - PubMed
    1. Altan-Bonnet N, Phair RD, Polishchuk RS, Weigert R, Lippincott-Schwartz J. A role for Arf1 in mitotic Golgi disassembly, chromosome segregation, and cytokinesis. Proc Natl Acad Sci U S A. 2003;100:13314–13319. - PMC - PubMed
    1. Sutterlin C, Hsu P, Mallabiabarrena A, Malhotra V. Fragmentation and dispersal of the pericentriolar Golgi complex is required for entry into mitosis in mammalian cells. Cell. 2002;109:359–369. - PubMed
    1. Yadav S, Puri S, Linstedt AD. A primary role for Golgi positioning in directed secretion, cell polarity, and wound healing. Mol Biol Cell. 2009;20:1728–1736. - PMC - PubMed
    1. Kupfer A, Louvard D, Singer SJ. Polarization of the Golgi apparatus and the microtubule-organizing center in cultured fibroblasts at the edge of an experimental wound. Proc Natl Acad Sci U S A. 1982;79:2603–2607. - PMC - PubMed

Publication types

MeSH terms