

doi: 10.1039/c3lc50905b.
DNA sequence analysis with droplet-based microfluidics
Affiliations
- PMID: 24185402
- PMCID: PMC4090915
- DOI: 10.1039/c3lc50905b
Item in Clipboard
DNA sequence analysis with droplet-based microfluidics
Lab Chip.
.
Abstract
Droplet-based microfluidic techniques can form and process micrometer scale droplets at thousands per second. Each droplet can house an individual biochemical reaction, allowing millions of reactions to be performed in minutes with small amounts of total reagent. This versatile approach has been used for engineering enzymes, quantifying concentrations of DNA in solution, and screening protein crystallization conditions. Here, we use it to read the sequences of DNA molecules with a FRET-based assay. Using probes of different sequences, we interrogate a target DNA molecule for polymorphisms. With a larger probe set, additional polymorphisms can be interrogated as well as targets of arbitrary sequence.
Figures
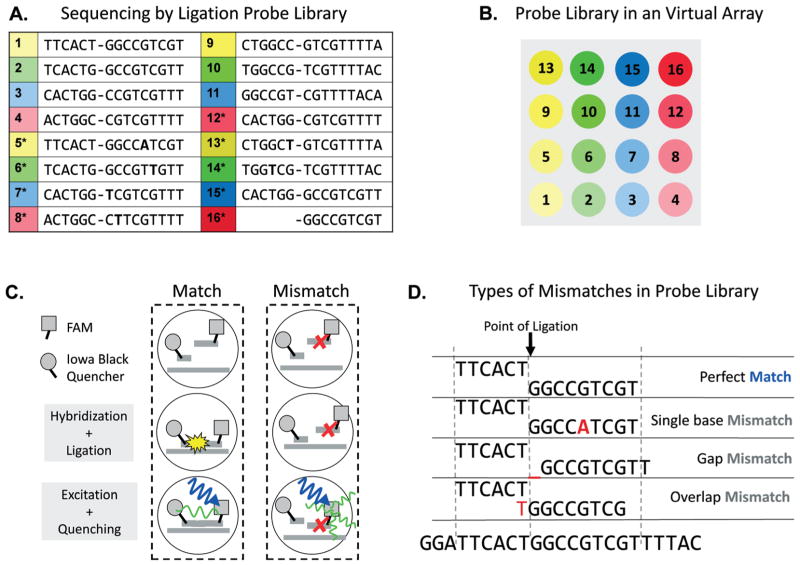
Schematic of FRET ligation assay used to read the sequences of a target molecule. The target is a synthetic 64 base molecule containing a sequence that is close to the end of the LacZ gene of Escherichia coli APEC O1. The list of probes used with associated identification numbers is shown in (A) and a schematic of the “virtual array” we used for our probe sets is shown in (B). Each of the probe sets is loaded into a well on a plate with fluorescent dyes mixed at concentrations so as to denote their position on the array. A schematic of our FRET ligation assay is shown in (C). For the FRET dye pair, we use FAM and Iowa Black Quencher; these dyes have the property that when in close proximity, the FAM emission is quenched, resulting in a loss of intensity. To use this to detect ligation, the 6mer probes are labeled with the quencher and the 9mer probes with FAM. If the probes are ligated, the dyes are brought into close proximity, resulting in a detectable quenching. The types of mismatches tested in our experiment are shown in (D). * denotes a probe composition expected to give a negative signal, and letters in bold represent single base pair mismatch.

Microfluidic system for analyzing the sequences of target molecules dispersed in a solution. Drops containing the probe sets are introduced into the microfluidic device and spaced by injection of oil, (A). The spaced drops then pass the picoinjector, where the solution containing the target DNA is injected. The injected drops are collected into a vial and incubated at room temperature for 1 h to allow the ligation reaction to complete, (B). They are then re-introduced into a droplet cytometer that spaces the drops and flows them through a laser, during which their fluorescence amplitudes are measured, (C). The drops are ~50 μm in diameter.
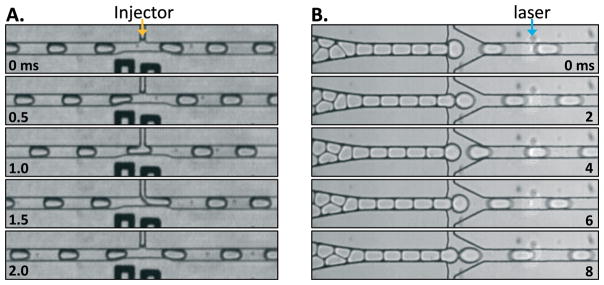
Image sequences recorded with a high-speed camera of the picoinjector (A) and the droplet cytometer (B). The drops are ~50 μm in diameter.
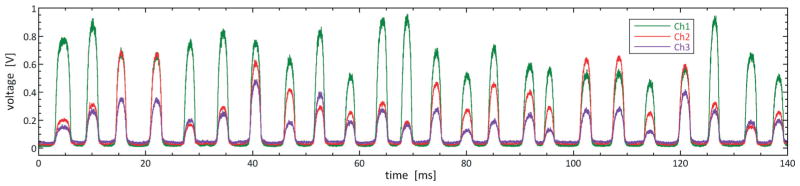
Intensity time traces of drops after incubation and the completion of the ligation assay. The time traces for the assay (green, channel 1), and label dyes (red and purple, channels 2 and 3) are plotted on top of each other. The drops appear as peaks in intensity as a function of time, separated by dim gaps corresponding to the passage of the non-fluorescent interstitial oil. The amplitudes of the peaks for a given drop depend on the dye label values and the outcome of the ligation assay.

(A) Two-dimensional histogram of drops detected in our experiment. The horizontal axis corresponds to the intensity of the drops on channel 2 (632 nm), while the vertical axis corresponds to the intensity on channel 3 (716 nm). The color of each bin corresponds to the number of drops detected with those two intensity levels. (B) The bounding boxes used to identify drops as belonging to a particular cluster are drawn around the center of each cluster.

(A) Average intensity at 536 nm for all clusters detected in our experiment, with error bars corresponding to the standard deviation. All matching probes are grouped to the left and mismatching probes to the right. A single threshold can be drawn to distinguish all matching probes from all mismatching probes, horizontal dotted line. (B) Tiling of our matching probes to reconstruct a portion of the LacZ gene.
References
-
- Tomlinson IM, Walter G, Marks JD, Llewelyn MB, Winter G. J Mol Biol. 1992;227(3):776–798. - PubMed
-
- de Wildt RMT, Hoet RMA, van Venrooij WJ, Tomlinson IM, Winter G. J Mol Biol. 1999;285(3):895–901. - PubMed
-
- Tringe SG, von Mering C, Kobayashi A, Salamov AA, Chen K, Chang HW, Podar M, Short JM, Mathur EJ, Detter JC, Bork P, Hugenholtz P, Rubin EM. Science. 2005;308(5721):554–557. - PubMed
-
- Heller MJ. Annu Rev Biomed Eng. 2002;4:129–153. - PubMed
Publication types
MeSH terms
Grants and funding
LinkOut - more resources
Full Text Sources
Other Literature Sources