. 2013 Dec;16(12):1764-72.
doi: 10.1038/nn.3569. Epub 2013 Nov 3.

Regulation of interneuron excitability by gap junction coupling with principal cells

Affiliations

Regulation of interneuron excitability by gap junction coupling with principal cells

Pierre F Apostolides et al. Nat Neurosci. 2013 Dec.

Abstract

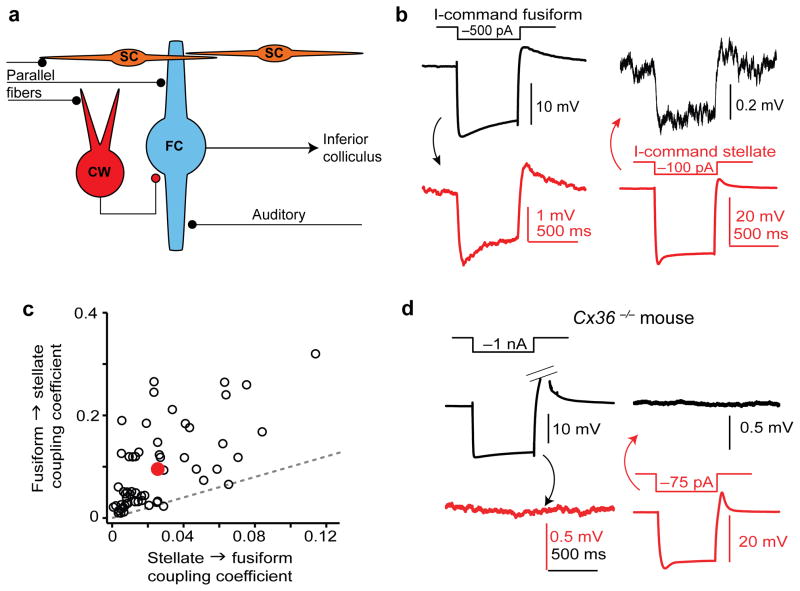
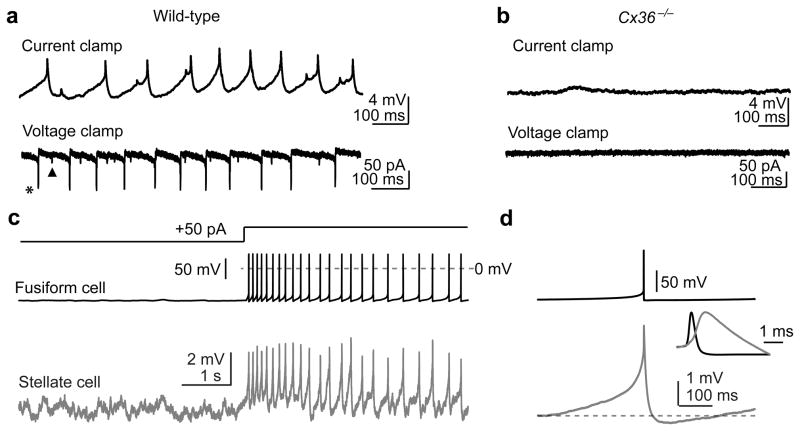
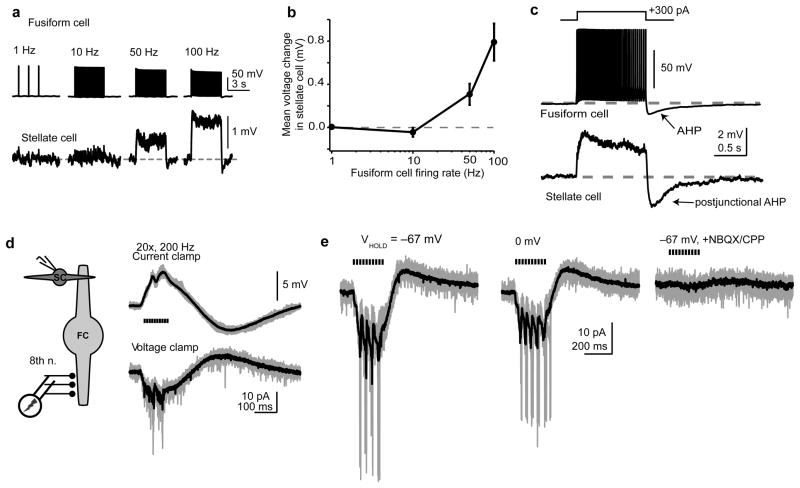
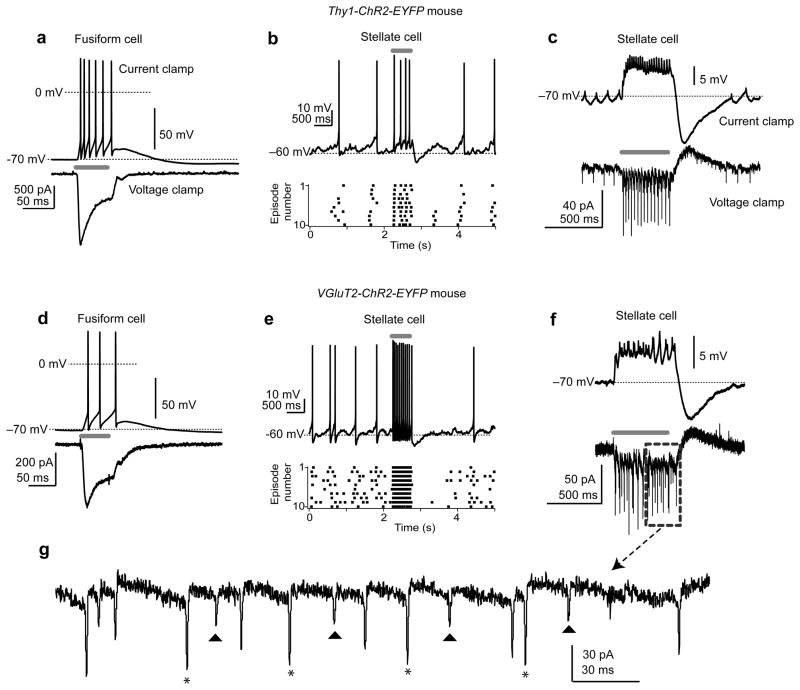
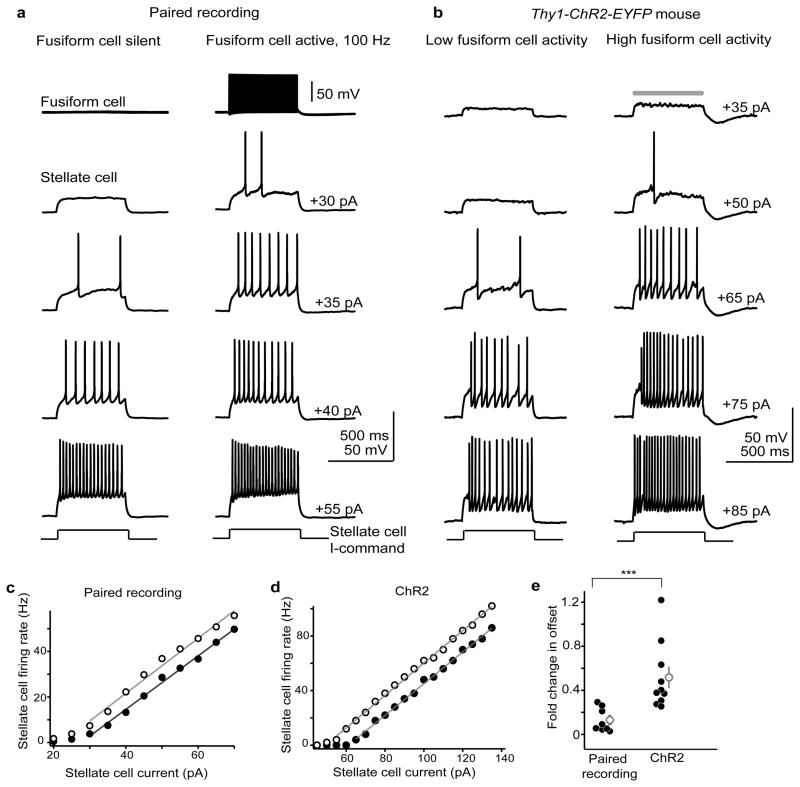
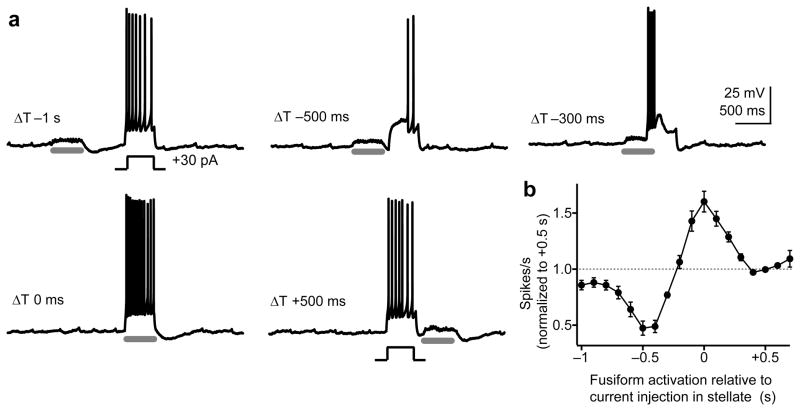
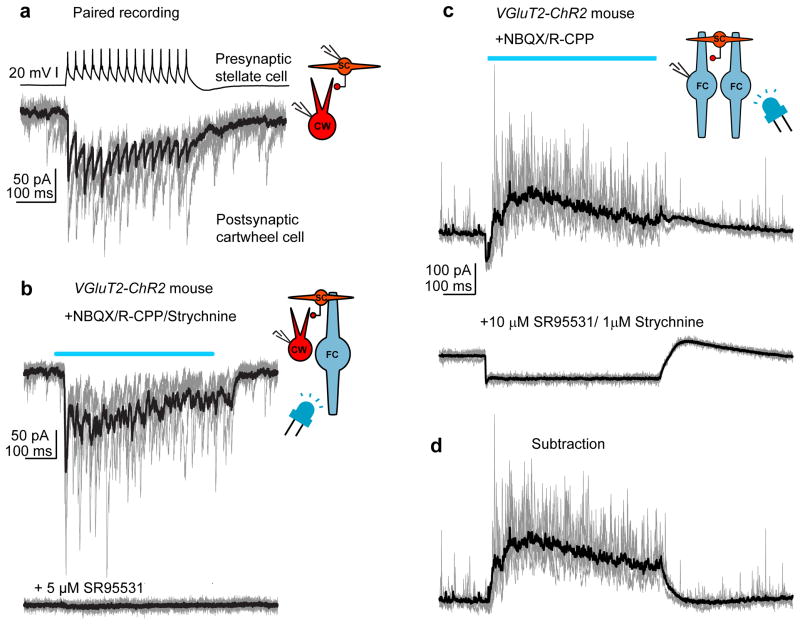
Electrical coupling of inhibitory interneurons can synchronize activity across multiple neurons, thereby enhancing the reliability of inhibition onto principal cell targets. It is unclear whether downstream activity in principal cells controls the excitability of such inhibitory networks. Using paired patch-clamp recordings, we show that excitatory projection neurons (fusiform cells) and inhibitory stellate interneurons of the dorsal cochlear nucleus form an electrically coupled network through gap junctions containing connexin36 (Cxc36, also called Gjd2). Remarkably, stellate cells were more strongly coupled to fusiform cells than to other stellate cells. This heterologous coupling was functionally asymmetric, biasing electrical transmission from the principal cell to the interneuron. Optogenetically activated populations of fusiform cells reliably enhanced interneuron excitability and generated GABAergic inhibition onto the postsynaptic targets of stellate cells, whereas deep afterhyperpolarizations following fusiform cell spike trains potently inhibited stellate cells over several hundred milliseconds. Thus, the excitability of an interneuron network is bidirectionally controlled by distinct epochs of activity in principal cells.


Figures

Figure 1
Figure 1. Asymmetric electrical coupling between DCN fusiform and stellate cells
a) Diagram of DCN circuitry. The excitatory projection neurons of the DCN (fusiform cells; FC), integrate excitatory auditory nerve and multisensory parallel fiber synapses. Parallel fibers, but not auditory nerve fibers, impinge upon two distinct types of inhibitory interneurons: cartwheel cells (CW) and superficial stellate cells (SC). b) Example average traces from an electrically-coupled fusiform/stellate pair. Negative current injection into the fusiform cell (black trace) causes the expected hyperpolarization. This causes a smaller voltage deflection with similar time course in the simultaneously recorded stellate cell (red trace, note the difference in scale). Similarly, hyperpolarizing the stellate cell causes a small voltage deflection in the fusiform cell. c) Summary of coupling coefficients for 57 pairs similar to (b). Red point is average ± s.e.m of the data set, and dotted gray line represents the unity line. Almost all pairs fall above the unity line, showing that the coupling coefficient is stronger in the fusiform-to-stellate direction compared to vice versa. d) Example average traces from a typical paired recording in a DCN slice from a Cx36−/− mouse. Color coding is similar to panel (b). Out of 60 attempts, only 3 pairs were connected.
Figure 2
Figure 2. Fusiform cells generate spikelets in electrically-coupled stellate cells
a) Spontaneous spikelet activity in a single stellate cell recorded in current- and voltage-clamp (upper and lower traces, respectively). Recordings were performed in the presence glutamate, glycine and GABAA receptor blockers. Spikelet events with two distinct amplitudes are apparent (e.g., see asterisk and triangle), suggesting that at least two prejunctional fusiform cells with different coupling coefficients coupled to the same stellate cell. b) Same experiment as (a), but in a Cx36−/− mouse. No spikelets were detected in knockout mice; (0/77 cells tested. χ2(1)=72.4, p<0.0001 compared to wild-type). Traces were recorded in the presence of synaptic blockers. c) Paired recording from electrically-coupled fusiform and stellate cells (upper and lower traces, respectively). The fusiform cell was driven to spike by current injection. Notice the immediate onset, uniform amplitude, and lack of transmission failures of spikelets in the stellate cell. d) Averages (acquisition triggered by detection of the prejunctional spike) from the same pair as in (c). Only spikes that occurred more than 300 ms apart were included in the average, to highlight the time course of the depolarizing and hyperpolarizing phases of the spikelet waveform. Inset shows the spikelet rising phase on a fast time base and normalized to the peak of the prejunctional spike, highlighting that spikelets rise before the downswing of the fusiform cell action potential.
Figure 3
Figure 3. Fusiform cell action potentials propagate into the distal apical dendrites
a-i) 2-photon maximum-intensity z-stack from the example in Figure 1b. The stellate and fusiform cells are filled with Alexa594 (red) and Alexa488 (green) dyes, respectively. Dotted white line represents the approximate ependymal border of the DCN. Stellate cell processes do not extend into the cell body layer, whereas fusiform cell processes span the entire length of the DCN. a-i) A maximal intensity z-stack at higher magnification from the same pair. a-iii) High magnification, single optical section of the area denoted by the white arrow in panel (b), showing a high degree of overlap between the stellate and fusiform cell processes (white dots). b) Right: Maximum intensity 2-photon z-stack from a representative fusiform cell showing line scan locations during the Ca2+ imaging experiment. Left: Example sweeps of action potential-evoked Fluo-5f Ca2+ transients (5 spikes, 50 Hz) recorded at the corresponding dendritic locations marked in the z-stack on the left. Each trace is an average of 20–25 trials. c) Absolute ΔG/R plotted as a function of approximate distance from the soma. Response amplitudes remain relatively constant along the dendrite. Each data point represents mean values ± s.e.m. from 3 to 6 individual cells.
Figure 4
Figure 4. Control the stellate cell membrane potential by fusiform cells and auditory nerve activity
a) Upper traces: fusiform cell spikes evoked at different frequencies (single trials). Lower traces: averages of multiple trials in an electrically-coupled stellate cell. b) Summary data (n=9) showing stellate cell mean voltage change ±s.e.m. from baseline vs. fusiform cell spike frequency. c) Current injection in a fusiform cell triggered high-frequency firing followed by post-train AHP upon stimulus offset (upper trace). Simultaneously recorded, postjunctional stellate cell (lower trace) was transiently depolarized above baseline) during fusiform cell spiking and hyperpolarized by the AHP upon stimulus termination. Top trace: single trial, bottom trace: average of eight sweeps. d) Activation of auditory nerve elicits biphasic signals in stellate cells. Left panel: A stimulating electrode was placed in the ventral cochlear nucleus (VCN) >600 μm from the recorded cell in DCN. Recording made in the presence of 1 μM strychnine/10 μM SR95531. Right panel: Stellate cell recorded in current or voltage clamp (upper and lower traces, respectively) during stimulation of the VCN (20 shocks at 5-ms intervals). In current clamp, negative bias current (−30 pA) was injected to prevent spike generation. e) VCN stimuli (10 shocks at 50 Hz) were delivered while the cell was clamped at −67 mV or 0 mV. Little difference was seen in response amplitude at the two potentials. Lower trace: 10 μM NBQX, 5 μM CPP eliminated the response, as expected for glutamatergic transmission from auditory nerve. For panels d+e, gray traces are 5 consecutive trials, and black traces are averages of 12–31 trials. Stimulus artifacts were blanked.
Figure 5
Figure 5. Optogenetic activation of fusiform cells depolarizes stellate cells
a) In a Thy1-ChR2-EYFP fusiform cell, light stimuli (50 ms; blue bar) generate spikes in current-clamp (upper traces) and photocurrents in voltage clamp (lower traces). Top trace: single trial, lower trace: average of multiple trials. b) Top: Current-clamp recording from a stellate cell in a Thy1-ChR2-EYFP mouse (zero bias current). A 500-ms light stimulus (gray bar) causes an immediate increase in spike frequency. Lower panel: Raster plot of ten trials, highlighting the increase in spike rate upon optogenetic stimulation of fusiform cells. Similar results obtained in 18/19 stellate cells. c) Stellate cell in a Thy1-ChR2-EYFP mouse (different cell from b). Top trace: Current clamp, −25 pA bias current injected to hyperpolarize the cell and prevent spike generation. Light flash (400 ms) causes spikelets riding atop a steady-state depolarization, followed by an AHP at light offset. Note similarity to the traces in Figure 4c. Lower trace: Same stimulus delivered when the cell is voltage-clamped at −70 mV causes a barrage of fast inward spikelets, followed by a slow outward current upon stimulus offset. Traces are single trials. d) A fusiform cell in a VGluT2-ChR2-EYFP mouse. Similar to Thy1-ChR2 mouse in panel (a), light (50 ms) drives spikes and induces photocurrents. e) Current-clamp recording from a stellate cell in the VGluT2-ChR2-EYFP mouse. The experiment and panel layout as in (b). f) A stellate cell in a VGluT2-ChR2 mouse showing that light stimuli cause depolarizations and inward currents as in the Thy1-ChR2 mouse. g) Enlargement of the area denoted by the gray dashed rectangle in (f). Note presence of spikelets with distinct amplitudes (denoted by triangles and asterisks), suggesting coupling to at least two fusiform cells with different coupling coefficients.
Figure 6
Figure 6. Fusiform cells control the spike rate of stellate cells
a) Single trials from an electrically-coupled fusiform-stellate cell pair. The stellate cell was depolarized with step pulses of increasing positive current (2.5–5 pA intervals; 500 ms duration) in absence or with simultaneous 100 Hz activity in the fusiform cell (left and right columns, respectively). Activity in the prejunctional fusiform cell increases the total number of spikes generated in the stellate cell with intermediate current steps. b) Example single trials from a stellate cell in a Thy1-ChR2 mouse. Traces show stellate cell spikes evoked by positive current injection (500 ms) with (right) and without (left) concurrent blue light flashes (gray bar, 500 ms) to activate prejunctional fusiform cells. c) Input/output curve for the pair in (a). Spike frequency (y-axis) is plotted as a function of current injection. Solid points represent values while the prejunctional cell was silent; open points are with concurrent prejunctional fusiform cell activity. The gray lines are linear fits to the non-zero portions of the data. d) Same as panel c, but for the ChR2 experiment. The open and filled circles represent the input-output curves of the example cell in (b) with and without simultaneous blue light flashes, respectively. e) Summary graph plotting the normalized change in offset (x-intercept) due to fusiform cell activity in paired recordings and ChR2 experiments. Gray points are mean ± s.e.m.. Asterisks denote statistical significance. Optogenetic stimulation caused a 3.7-fold greater shift in offset compared to paired recordings (t(16)=3.4, p=0.004, unpaired t-test).
Figure 7
Figure 7. The timing of fusiform cell activity bi-directionally controls stellate cell spike output
a) Single trials from a stellate cell in a VgluT2-ChR2 mouse where the cell was transiently driven to spike via positive current injection (400 ms). Prejunctional fusiform cells were activated by blue light (gray bars, 400 ms) at various times relative to the current step in the stellate cell. Negative bias current was used to prevent spontaneous firing. b) Summary graph from 13 stellate cells in ChR2 mice plotting normalized spikes/s as a function of flash timing relative to stellate cell current injection. The data (means ± s.e.m.) are normalized to the +500 ms data point, where the light flash (and thus, fusiform cell activation) occurred after the current step in the stellate cell.
Figure 8
Figure 8. Fusiform cells generate inhibition in the DCN
a) Paired recording between a presynaptic stellate and postsynaptic cartwheel cell. GABAergic transmission isolated with glutamate and glycine receptor blockers. 15 action potentials were elicited at 50 Hz in the stellate cell, resulting in a time-locked series of IPSCs in the postsynaptic cartwheel cell. IPSCs are inward as the cartwheel cell is recorded with a Cl rich internal solution. Gray traces are 4 single sweeps, black is an average of 20 trials. b) A cartwheel cell in a VGluT2-ChR2 mouse. Top trace: Optogenetic stimulation of fusiform cells, denoted by the blue line, results in a barrage of IPSCs in the cartwheel cell. Lower trace: The GABAA receptor antagonist SR95531 blocks the optogenetically-evoked IPSCs. Gray traces are 4 single sweeps, black is an average of 10 trials in each condition. c) Example recording from a fusiform cell in a VGluT2-ChR2 mouse. The cell is voltage-clamped at 0 mV, generating a net outward driving for Cl currents. Upper panel: Activating neighboring fusiform cells via blue light stimuli (500 ms) causes a powerful increase in IPSC frequency. Lower panel: IPSCs are blocked by the addition of GABAA/glycine receptor blockers SR95531 and strychnine, revealing an inward photocurrent during the light stimulus. Gray traces are 5 consecutive trials. Black traces are an average of 20 to 23 trials. d) Same example traces as those in the upper panel of (c), but with the average photocurrent digitally subtracted. Thus, activation of neighboring fusiform cells causes an inhibitory outward current for the duration of the light stimulus.

References

    1. Bell CC, Han V, Sawtell NB. Cerebellum-like structures and their implications for cerebellar function. Annu Rev Neurosci. 2008;31:1–24. - PubMed
    1. Dean P, Porrill J, Ekerot CF, Jörntell H. The cerebellar microcircuit as an adaptive filter: experimental and computational evidence. Nat Rev Neurosci. 2010;11:30–43. - PubMed
    1. Requarth T, Sawtell NB. Neural mechanisms for filtering self-generated sensory signals in cerebellum-like circuits. Curr Opin Neurobiol. 2011;21:602–608. - PubMed
    1. Oertel D, Young ED. What’s a cerebellar circuit doing in the auditory system? Trends Neurosci. 2004;27:104–110. - PubMed
    1. Roberts MT, Trussell LO. Molecular layer inhibitory interneurons provide feedforward and lateral inhibition in the dorsal cochlear nucleus. J Neurophysiol. 2010;104:2462–2473. - PMC - PubMed

Publication types

MeSH terms

LinkOut - more resources