

A novel rapid-onset high-penetrance plasmacytoma mouse model driven by deregulation of cMYC cooperating with KRAS12V in BALB/c mice
- PMID: 24185503
- PMCID: PMC3880436
- DOI: 10.1038/bcj.2013.53
A novel rapid-onset high-penetrance plasmacytoma mouse model driven by deregulation of cMYC cooperating with KRAS12V in BALB/c mice
Abstract
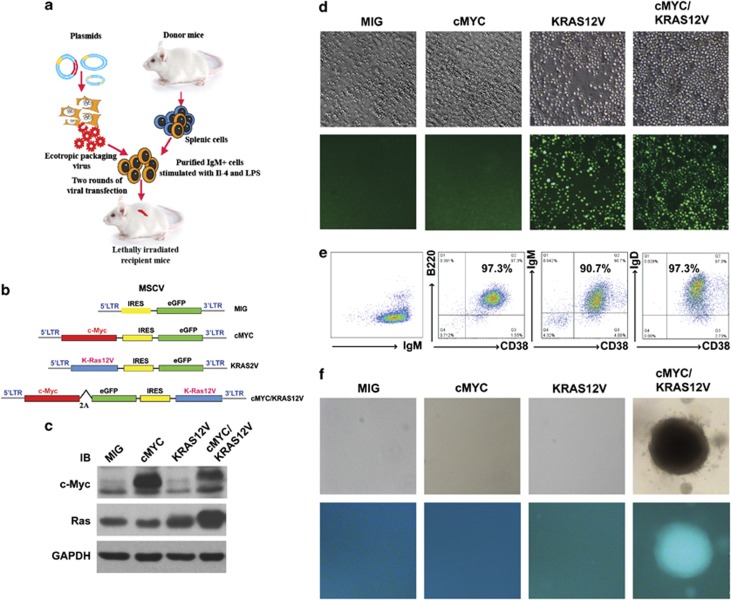
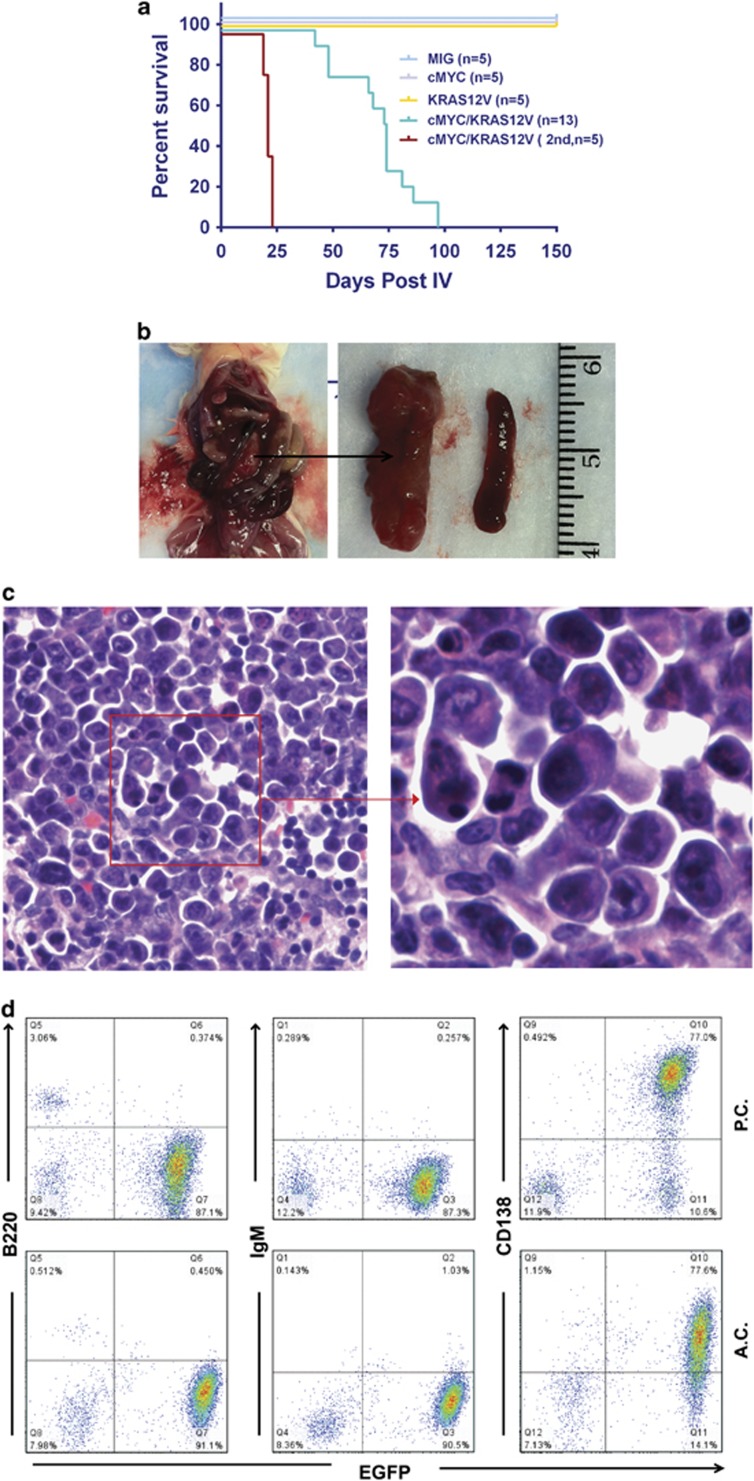
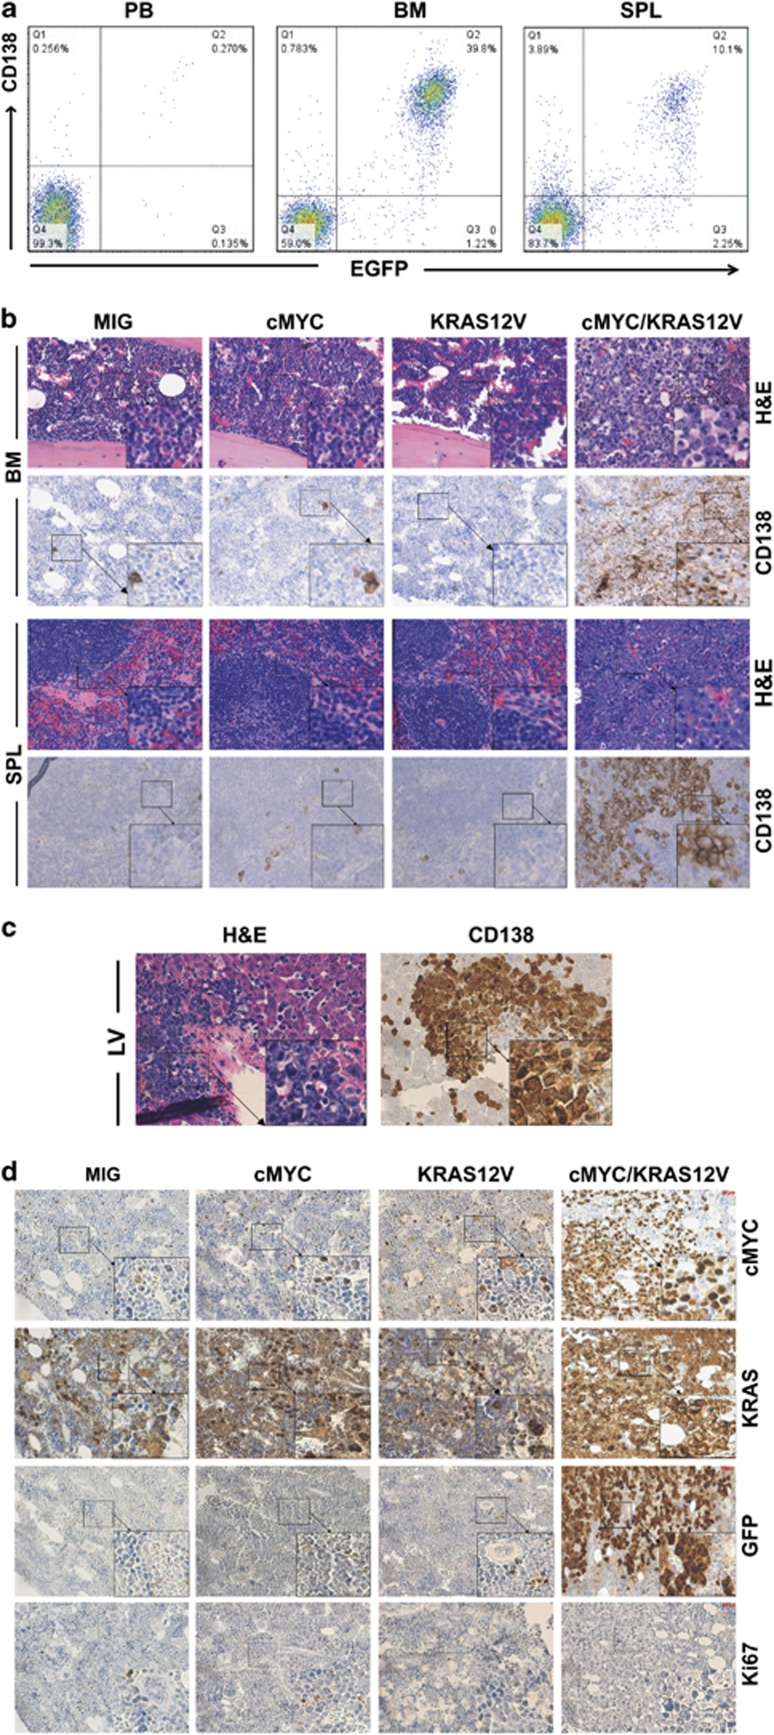
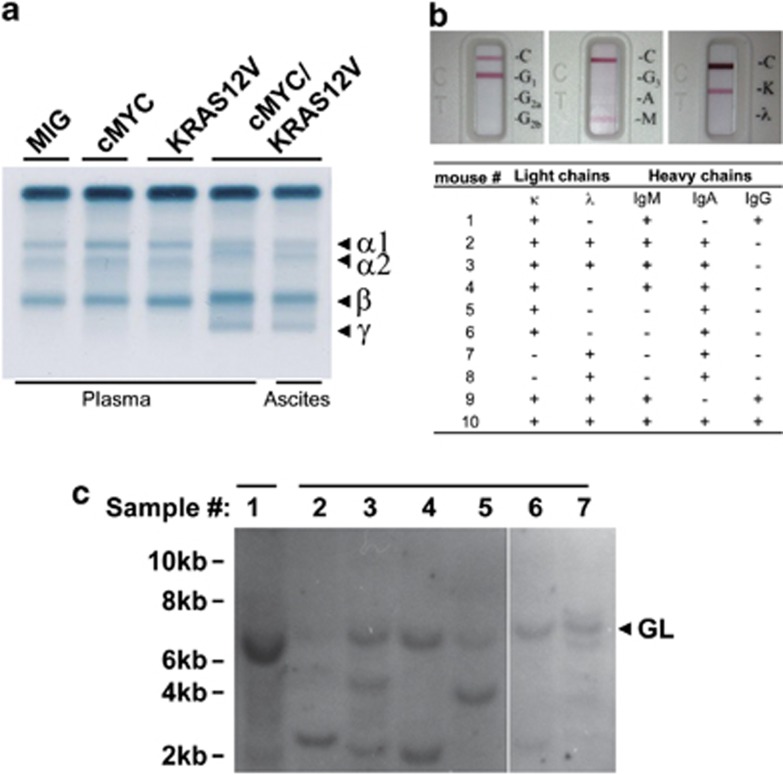
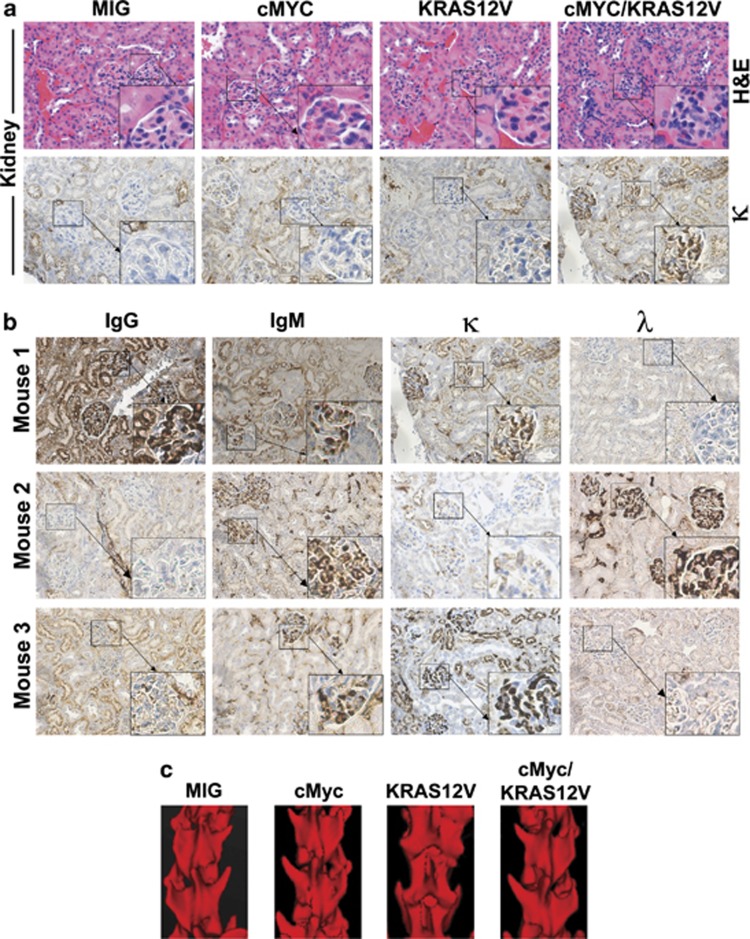
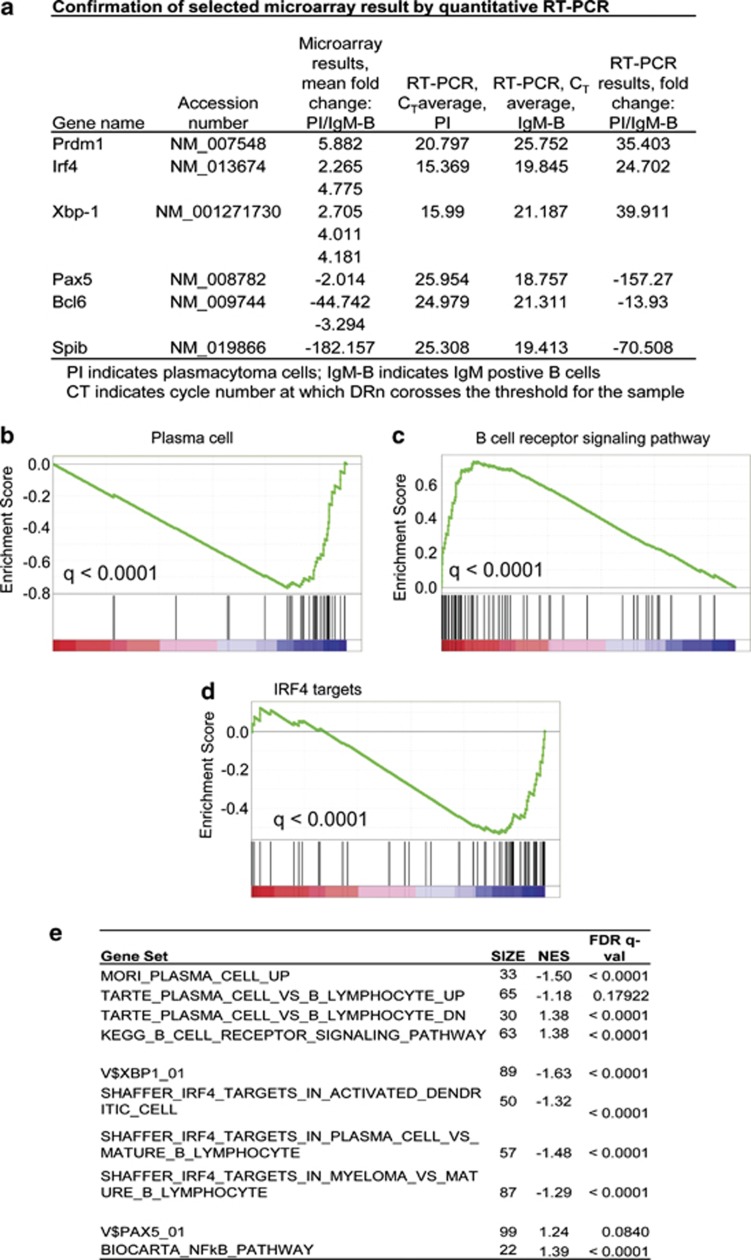
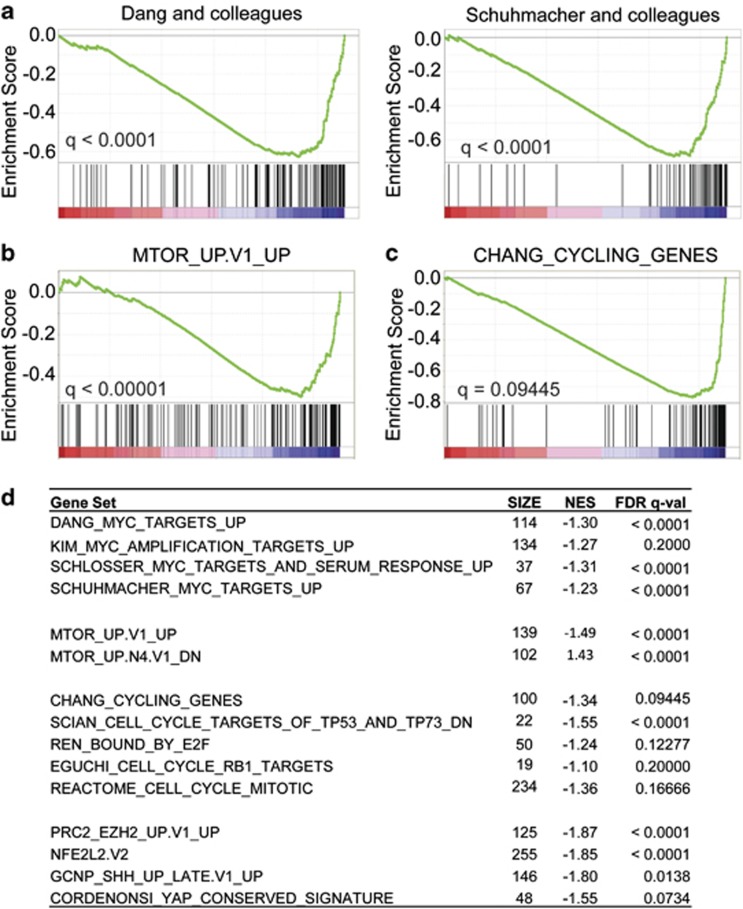
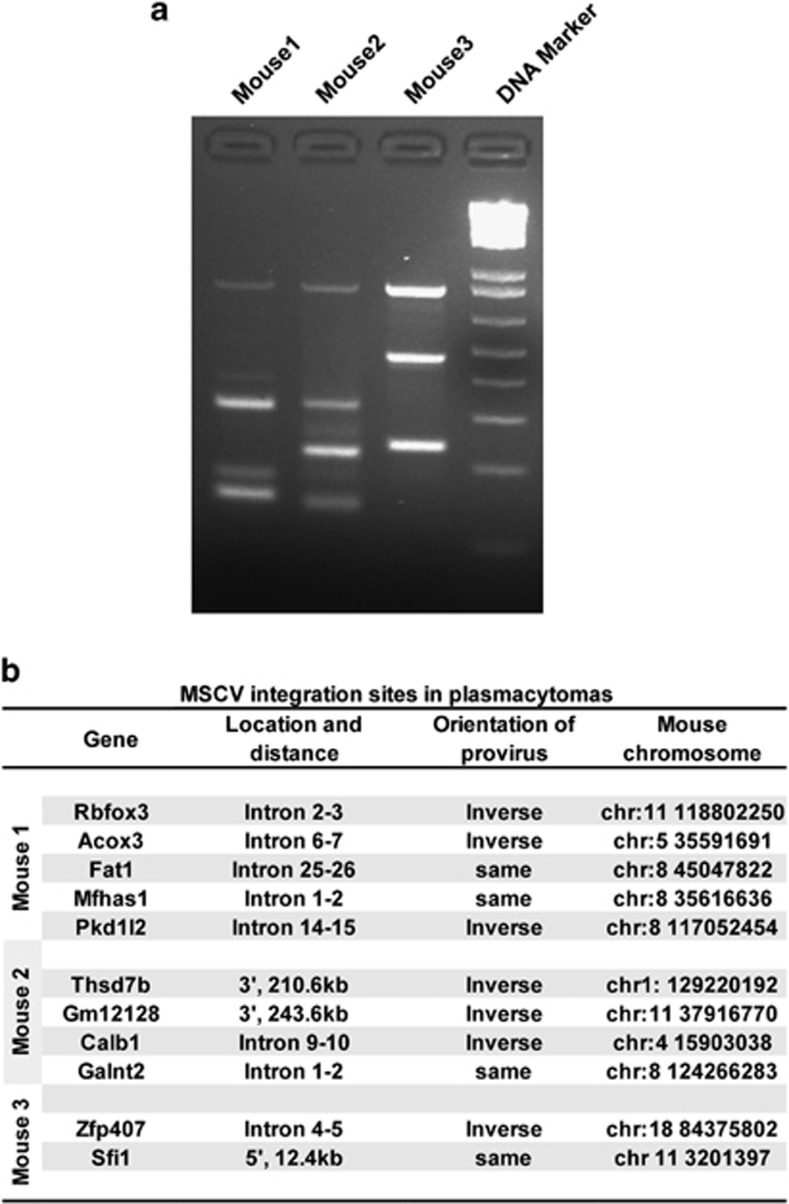
Our goal is to develop a rapid and scalable system for functionally evaluating deregulated genes in multiple myeloma (MM). Here, we forcibly expressed human cMYC and KRAS12V in mouse T2 B cells (IgM(+)B220(+)CD38(+)IgD(+)) using retroviral transduction and transplanted these cells into lethally irradiated recipient mice. Recipients developed plasmacytomas with short onset (70 days) and high penetrance, whereas neither cMYC nor KRAS12V alone induced disease in recipient mice. Tumor cell morphology and cell surface biomarkers (CD138(+)B220(-)IgM(-)GFP(+)) indicate a plasma cell neoplasm. Gene set enrichment analysis further confirms that the tumor cells have a plasma cell gene expression signature. Plasmacytoma cells infiltrated multiple loci in the bone marrow, spleen and liver; secreted immunoglobulins; and caused glomerular damage. Our findings therefore demonstrate that deregulated expression of cMYC with KRAS12V in T2 B cells rapidly generates a plasma cell disease in mice, suggesting utility of this model both to elucidate molecular pathogenesis and to validate novel targeted therapies.
Figures
Similar articles
-
Targeting glutaminase1 and synergizing with clinical drugs achieved more promising antitumor activity on multiple myeloma.Oncotarget. 2019 Oct 15;10(57):5993-6005. doi: 10.18632/oncotarget.27243. eCollection 2019 Oct 15. Oncotarget. 2019. PMID: 31666930 Free PMC article.
-
Novel targeted deregulation of c-Myc cooperates with Bcl-X(L) to cause plasma cell neoplasms in mice.J Clin Invest. 2004 Jun;113(12):1763-73. doi: 10.1172/JCI20369. J Clin Invest. 2004. PMID: 15199411 Free PMC article.
-
Anaplastic, plasmablastic, and plasmacytic plasmacytomas of mice: relationships to human plasma cell neoplasms and late-stage differentiation of normal B cells.Cancer Res. 2007 Mar 15;67(6):2439-47. doi: 10.1158/0008-5472.CAN-06-1561. Cancer Res. 2007. PMID: 17363561
-
Mouse plasmacytoma: an experimental model of human multiple myeloma.Haematologica. 2001 Mar;86(3):227-36. Haematologica. 2001. PMID: 11255268 Review.
-
The use of animal models in multiple myeloma.Morphologie. 2015 Jun;99(325):63-72. doi: 10.1016/j.morpho.2015.01.003. Epub 2015 Apr 17. Morphologie. 2015. PMID: 25898798 Review.
Cited by
-
Transgenic mouse model of IgM+ lymphoproliferative disease mimicking Waldenström macroglobulinemia.Blood Cancer J. 2016 Nov 4;6(11):e488. doi: 10.1038/bcj.2016.95. Blood Cancer J. 2016. PMID: 27813533 Free PMC article.
-
Preclinical and first-in-human of purinostat mesylate, a novel selective HDAC I/IIb inhibitor, in relapsed/refractory multiple myeloma and lymphoma.Signal Transduct Target Ther. 2025 Jun 23;10(1):201. doi: 10.1038/s41392-025-02285-w. Signal Transduct Target Ther. 2025. PMID: 40562746 Free PMC article. Clinical Trial.
-
Laboratory Mice - A Driving Force in Immunopathology and Immunotherapy Studies of Human Multiple Myeloma.Front Immunol. 2021 Jun 2;12:667054. doi: 10.3389/fimmu.2021.667054. eCollection 2021. Front Immunol. 2021. PMID: 34149703 Free PMC article. Review.
-
CSNK1α1 mediates malignant plasma cell survival.Leukemia. 2015 Feb;29(2):474-82. doi: 10.1038/leu.2014.202. Epub 2014 Jun 25. Leukemia. 2015. PMID: 24962017 Free PMC article.
-
Adoptive B-cell transfer mouse model of human myeloma.Leukemia. 2016 Apr;30(4):962-6. doi: 10.1038/leu.2015.197. Epub 2015 Jul 23. Leukemia. 2016. PMID: 26202932 Free PMC article. No abstract available.
References
-
- Kyle RA, Rajkumar SV. Multiple myeloma. N Engl J Med. 2004;351:1860–1873. - PubMed
-
- Kuehl WM, Bergsagel PL. Multiple myeloma: evolving genetic events and host interactions. Nat Rev Cancer. 2002;2:175–187. - PubMed
-
- Bergsagel PL, Kuehl WM. Molecular pathogenesis and a consequent classification of multiple myeloma. J Clin Oncol. 2005;23:6333–6338. - PubMed
-
- Shaughnessy J, Tian E, Sawyer J, Bumm K, Landes R, Badros A, et al. High incidence of chromosome 13 deletion in multiple myeloma detected by multiprobe interphase FISH. Blood. 2000;96:1505–1511. - PubMed
-
- Bergsagel PL, Kuehl WM. Chromosome translocations in multiple myeloma. Oncogene. 2001;20:5611–5622. - PubMed
Grants and funding
LinkOut - more resources
Full Text Sources
Other Literature Sources
Research Materials
