

A multifunctional protein EWS regulates the expression of Drosha and microRNAs
- PMID: 24185621
- PMCID: PMC3857629
- DOI: 10.1038/cdd.2013.144
A multifunctional protein EWS regulates the expression of Drosha and microRNAs
Abstract
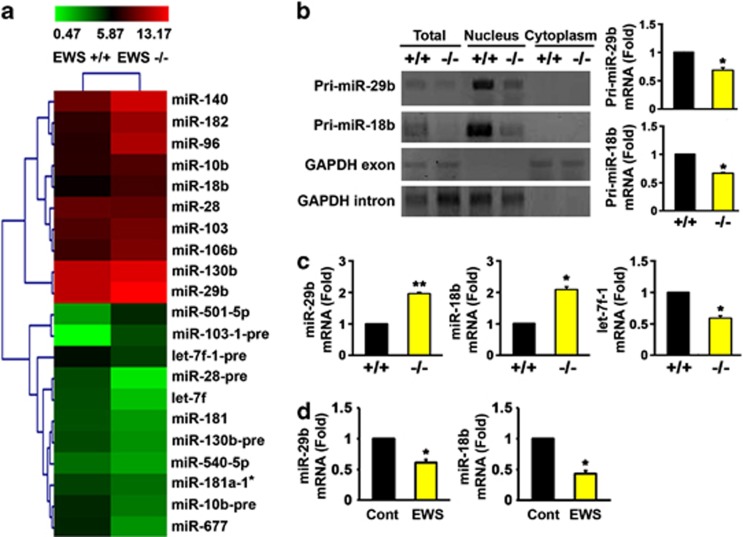
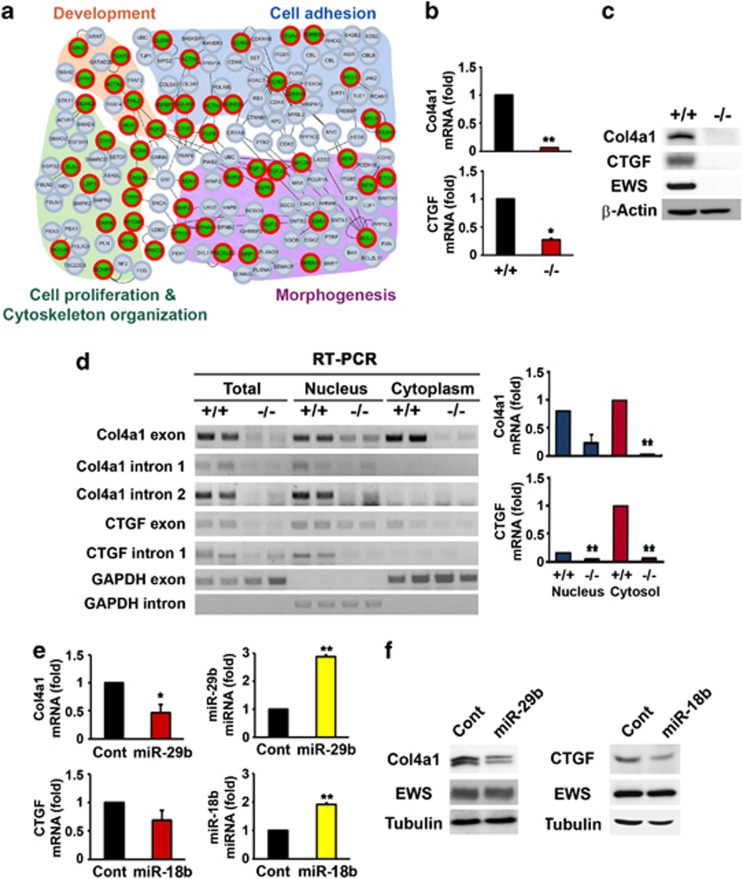
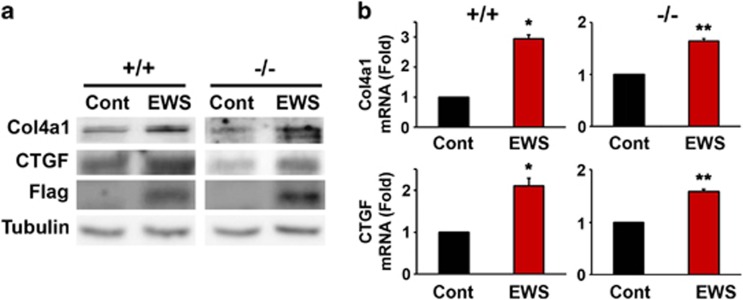
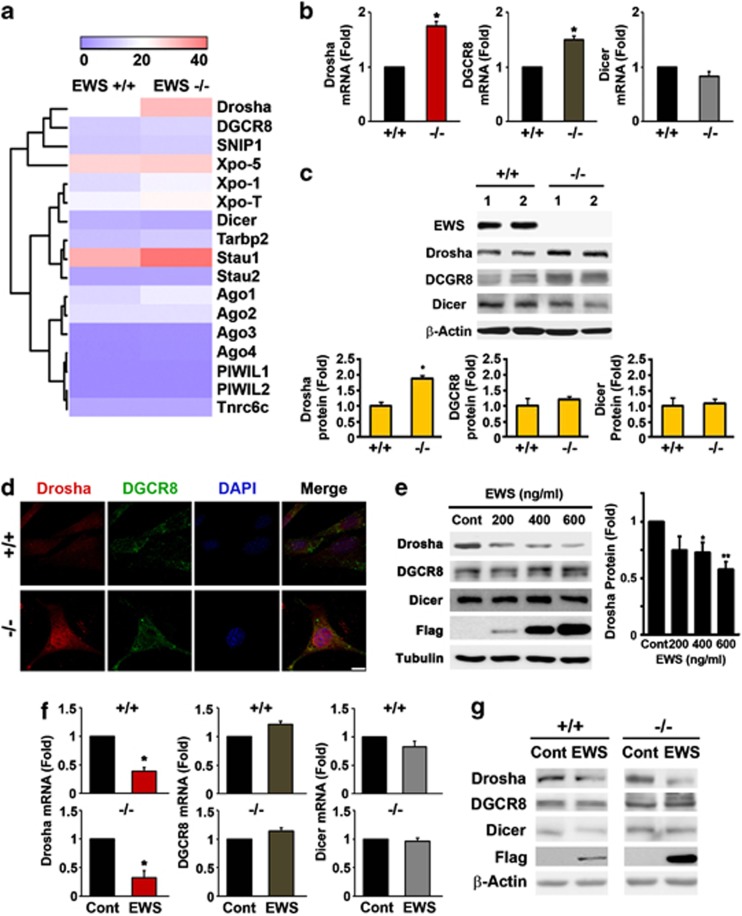
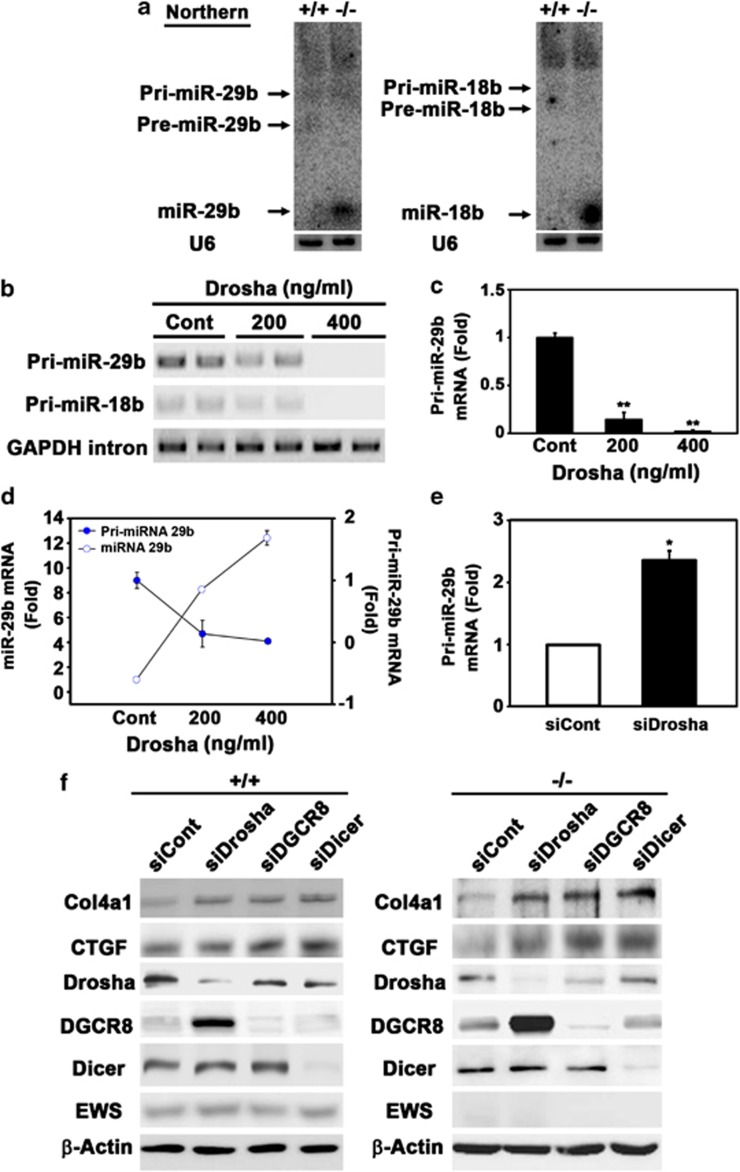
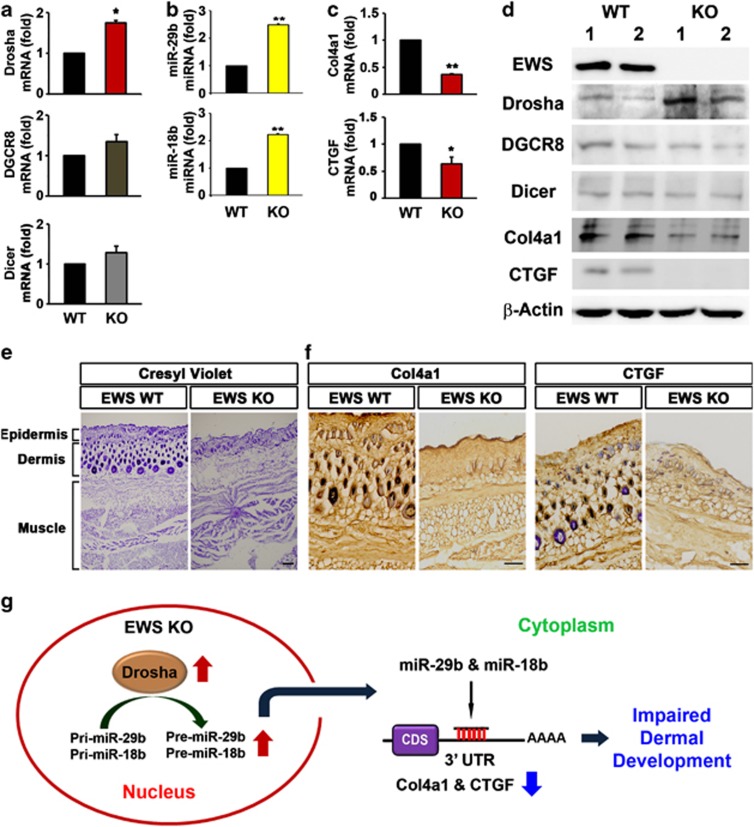
EWS (Ewing's Sarcoma) gene encodes an RNA/DNA-binding protein that is ubiquitously expressed and involved in various cellular processes. EWS deficiency leads to impaired development and early senescence through unknown mechanisms. We found that EWS regulates the expression of Drosha and microRNAs (miRNAs). EWS deficiency resulted in increased expression of Drosha, a well-known microprocessor, and increased levels of miR-29b and miR-18b. Importantly, miR-29b and miR-18b were directly involved in the post-transcriptional regulation of collagen IV alpha 1 (Col4a1) and connective tissue growth factor (CTGF) in EWS knock-out (KO) mouse embryonic fibroblast cells. The upregulation of Drosha, miR-29b and miR-18b and the sequential downregulation of Col4a1 and CTGF contributed to the deregulation of dermal development in EWS KO mice. Otherwise, knockdown of Drosha rescued miRNA-dependent downregulation of Col4a1 and CTGF proteins. Taken together, our data indicate that EWS is involved in post-transcriptional regulation of Col4a1 and CTGF via a Drosha-miRNA-dependent pathway. This finding suggests that EWS has a novel role in dermal morphogenesis through the modulation of miRNA biogenesis.
Figures
Similar articles
-
The RNA binding protein EWS is broadly involved in the regulation of pri-miRNA processing in mammalian cells.Nucleic Acids Res. 2017 Dec 1;45(21):12481-12495. doi: 10.1093/nar/gkx912. Nucleic Acids Res. 2017. PMID: 30053258 Free PMC article.
-
Accumulation of pre-let-7g and downregulation of mature let-7g with the depletion of EWS.Biochem Biophys Res Commun. 2012 Sep 14;426(1):89-93. doi: 10.1016/j.bbrc.2012.08.041. Epub 2012 Aug 14. Biochem Biophys Res Commun. 2012. PMID: 22910415
-
Uvrag targeting by Mir125a and Mir351 modulates autophagy associated with Ewsr1 deficiency.Autophagy. 2015;11(5):796-811. doi: 10.1080/15548627.2015.1035503. Autophagy. 2015. PMID: 25946189 Free PMC article.
-
Loss of connective tissue growth factor as an unfavorable prognosis factor activates miR-18b by PI3K/AKT/C-Jun and C-Myc and promotes cell growth in nasopharyngeal carcinoma.Cell Death Dis. 2013 May 16;4(5):e634. doi: 10.1038/cddis.2013.153. Cell Death Dis. 2013. PMID: 23681229 Free PMC article.
-
EWSR1, a multifunctional protein, regulates cellular function and aging via genetic and epigenetic pathways.Biochim Biophys Acta Mol Basis Dis. 2019 Jul 1;1865(7):1938-1945. doi: 10.1016/j.bbadis.2018.10.042. Epub 2018 Nov 24. Biochim Biophys Acta Mol Basis Dis. 2019. PMID: 30481590 Free PMC article. Review.
Cited by
-
Sequencing Overview of Ewing Sarcoma: A Journey across Genomic, Epigenomic and Transcriptomic Landscapes.Int J Mol Sci. 2015 Jul 16;16(7):16176-215. doi: 10.3390/ijms160716176. Int J Mol Sci. 2015. PMID: 26193259 Free PMC article. Review.
-
Inactivation of EWS reduces PGC-1α protein stability and mitochondrial homeostasis.Proc Natl Acad Sci U S A. 2015 May 12;112(19):6074-9. doi: 10.1073/pnas.1504391112. Epub 2015 Apr 27. Proc Natl Acad Sci U S A. 2015. PMID: 25918410 Free PMC article.
-
Genetic Ablation of EWS RNA Binding Protein 1 (EWSR1) Leads to Neuroanatomical Changes and Motor Dysfunction in Mice.Exp Neurobiol. 2018 Apr;27(2):103-111. doi: 10.5607/en.2018.27.2.103. Epub 2018 Apr 26. Exp Neurobiol. 2018. PMID: 29731676 Free PMC article.
-
The RNA binding protein EWS is broadly involved in the regulation of pri-miRNA processing in mammalian cells.Nucleic Acids Res. 2017 Dec 1;45(21):12481-12495. doi: 10.1093/nar/gkx912. Nucleic Acids Res. 2017. PMID: 30053258 Free PMC article.
-
EWSR1::ATF1 Translocation: A Common Tumor Driver of Distinct Human Neoplasms.Int J Mol Sci. 2024 Dec 21;25(24):13693. doi: 10.3390/ijms252413693. Int J Mol Sci. 2024. PMID: 39769457 Free PMC article. Review.
References
-
- Rossow KL, Janknecht R. The Ewing's sarcoma gene product functions as a transcriptional activator. Cancer Res. 2001;61:2690–2695. - PubMed
-
- Araya N, Hirota K, Shimamoto Y, Miyagishi M, Yoshida E, Ishida J, et al. Cooperative interaction of EWS with CREB-binding protein selectively activates hepatocyte nuclear factor 4-mediated transcription. J Biol Chem. 2003;278:5427–5432. - PubMed
-
- Lee J, Rhee BK, Bae GY, Han YM, Kim J. Stimulation of Oct-4 activity by Ewing's sarcoma protein. Stem Cells. 2005;23:738–751. - PubMed
Publication types
MeSH terms
Substances
Grants and funding
LinkOut - more resources
Full Text Sources
Other Literature Sources
Molecular Biology Databases
Research Materials
Miscellaneous
