. 2013 Dec;10(12):1177-84.
doi: 10.1038/nmeth.2714. Epub 2013 Nov 3.

Assessment of transcript reconstruction methods for RNA-seq

Collaborators, Affiliations

Assessment of transcript reconstruction methods for RNA-seq

Tamara Steijger et al. Nat Methods. 2013 Dec.

Abstract

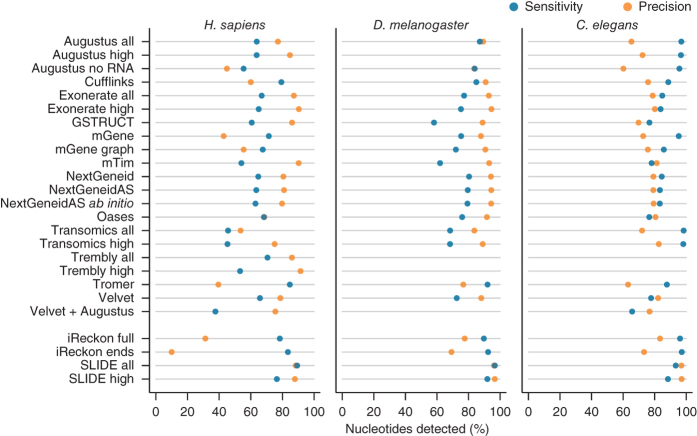
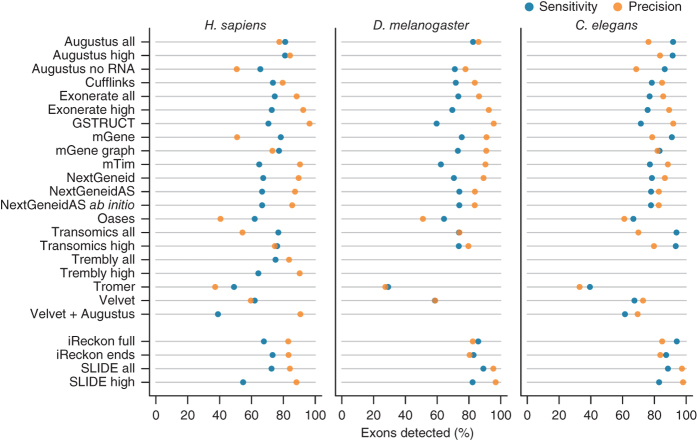
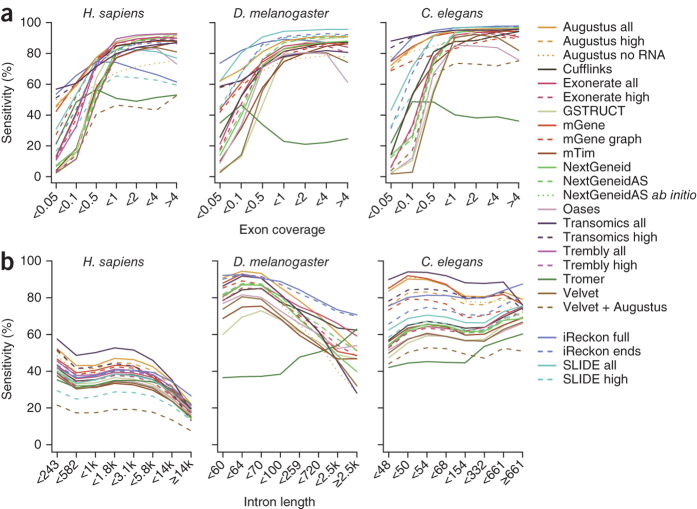
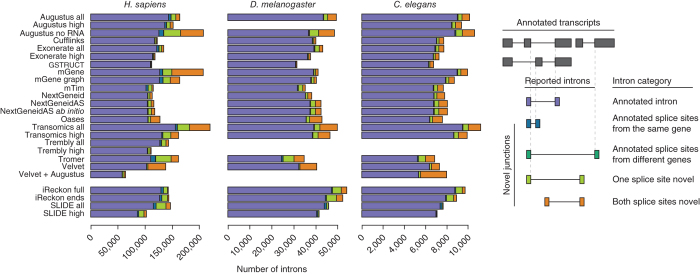
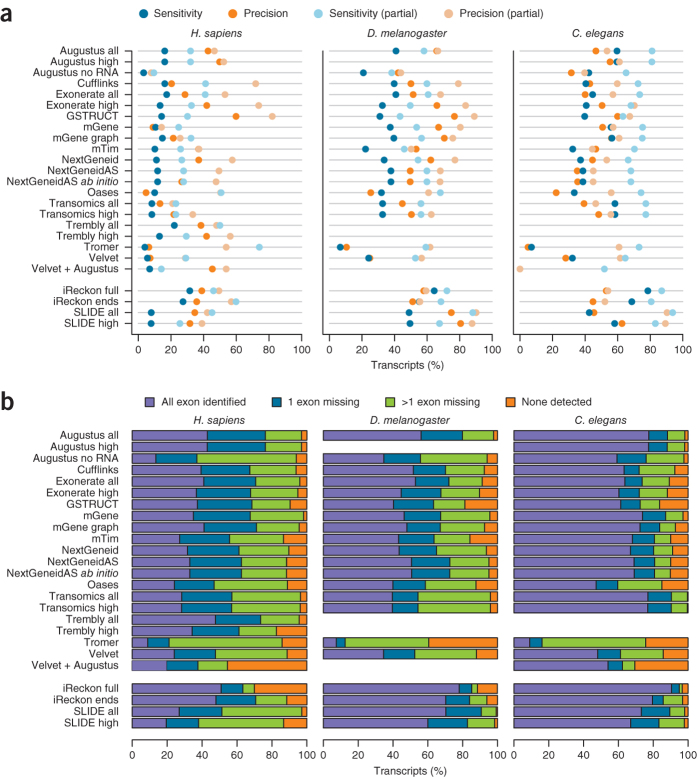
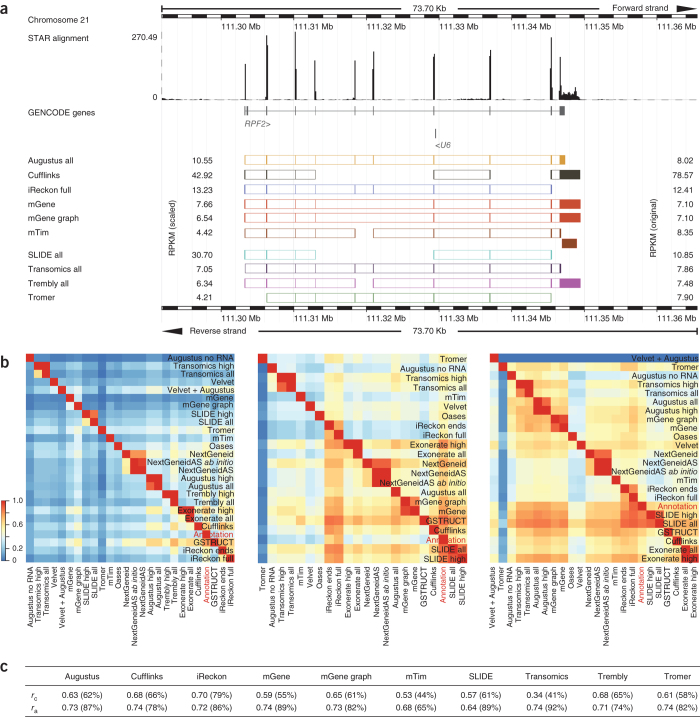
We evaluated 25 protocol variants of 14 independent computational methods for exon identification, transcript reconstruction and expression-level quantification from RNA-seq data. Our results show that most algorithms are able to identify discrete transcript components with high success rates but that assembly of complete isoform structures poses a major challenge even when all constituent elements are identified. Expression-level estimates also varied widely across methods, even when based on similar transcript models. Consequently, the complexity of higher eukaryotic genomes imposes severe limitations on transcript recall and splice product discrimination that are likely to remain limiting factors for the analysis of current-generation RNA-seq data.


Conflict of interest statement

The authors declare no competing financial interests.

Figures

Figure 1
Figure 1. Summary of nucleotide-level performance for the methods evaluated.
The plots show performance at detecting exonic nucleotides. Sensitivity (blue) indicates the proportion of known exon sequence in each genome covered by assembled transcripts, and precision (orange) indicates the proportion of reported expressed sequence confined to known exons. Some protocol variants considered all expressed transcripts (all) or excluded those of low abundance (high). Programs run with gene annotation are grouped separately. iReckon was run with complete reference annotation (full) and with transcript boundaries only (ends). Transcript reconstruction methods are described in the Supplementary Note. Source data
Figure 2
Figure 2. Summary of exon-level performance for the methods evaluated.
The plots show performance at detecting individual exons as the percentage of reference exons with a matching feature in the submission (sensitivity, blue) and the proportion of reported exons that agree with annotation (precision, orange). Source data
Figure 3
Figure 3. Influence of read depth and intron length on detection performance.
(a) Sensitivity for detection of annotated exons stratified by read depth. (b) Annotated introns were binned on length, and sensitivity was calculated separately for each bin. Source data
Figure 4
Figure 4. Intron classification.
Reported introns were classified by overlap with splice sites annotated in the reference gene sets. Source data
Figure 5
Figure 5. Transcript assembly performance.
(a) Reference transcripts with a matching submission entry (transcript-level sensitivity, blue) and reported transcripts that match the reference (transcript-level precision, orange). (b) Transcripts for which various subsets of constituent exons have been reported. Source data
Figure 6
Figure 6. Examples of transcript calls and expression-level estimates.
(a) The upper tracks show RNA-seq read coverage (from STAR alignments; see Online Methods) and annotated genes. Exon predictions from the ten methods that quantified transcripts are illustrated below the annotated gene by colored boxes. Exons predicted to belong to the same transcript isoform are connected. Original and median-scaled RPKM values are presented to the right and left, respectively, of the transcript models. For the gene RPF2, all methods reported different isoforms and expression levels. Where multiple overlapping isoforms were identified, that with the higher RPKM was selected for visualization, and spliced isoforms were prioritized over unspliced ones. The noncoding RNA U6 is not expressed. (b) Heat maps illustrate pairwise agreement between reported transcript isoforms for H. sapiens (left), D. melanogaster (center) and C. elegans (right). (c) Correlation between reported RPKM values and NanoString counts (Pearson r of log-transformed values). NanoString counts were compared to the highest RPKM value reported for transcript isoforms consistent with the probe design (correlation rc) or for any isoform from the locus (correlation ra). Source data

Comment in

Similar articles

Cited by

References

    1. Trapnell C, et al. Transcript assembly and quantification by RNA-Seq reveals unannotated transcripts and isoform switching during cell differentiation. Nat. Biotechnol. 2010;28:511–515. doi: 10.1038/nbt.1621. - DOI - PMC - PubMed
    1. Mezlini AM, et al. iReckon: simultaneous isoform discovery and abundance estimation from RNA-seq data. Genome Res. 2013;23:519–529. doi: 10.1101/gr.142232.112. - DOI - PMC - PubMed
    1. Roberts A, Pimentel H, Trapnell C, Pachter L. Identification of novel transcripts in annotated genomes using RNA-Seq. Bioinformatics. 2011;27:2325–2329. doi: 10.1093/bioinformatics/btr355. - DOI - PubMed
    1. Li JJ, Jiang C-R, Brown JB, Huang H, Bickel PJ. Sparse linear modeling of next-generation mRNA sequencing (RNA-Seq) data for isoform discovery and abundance estimation. Proc. Natl. Acad. Sci. USA. 2011;108:19867–19872. doi: 10.1073/pnas.1113972108. - DOI - PMC - PubMed
    1. Schulz MH, Zerbino DR, Vingron M, Birney E. Oases: robust de novo RNA-seq assembly across the dynamic range of expression levels. Bioinformatics. 2012;28:1086–1092. doi: 10.1093/bioinformatics/bts094. - DOI - PMC - PubMed

Publication types