

Review
doi: 10.1101/cshperspect.a021220.
Mitochondrial DNA genetics and the heteroplasmy conundrum in evolution and disease
Affiliations
- PMID: 24186072
- PMCID: PMC3809581
- DOI: 10.1101/cshperspect.a021220
Item in Clipboard
Review
Mitochondrial DNA genetics and the heteroplasmy conundrum in evolution and disease
Cold Spring Harb Perspect Biol.
.
Abstract
The unorthodox genetics of the mtDNA is providing new perspectives on the etiology of the common "complex" diseases. The maternally inherited mtDNA codes for essential energy genes, is present in thousands of copies per cell, and has a very high mutation rate. New mtDNA mutations arise among thousands of other mtDNAs. The mechanisms by which these "heteroplasmic" mtDNA mutations come to predominate in the female germline and somatic tissues is poorly understood, but essential for understanding the clinical variability of a range of diseases. Maternal inheritance and heteroplasmy also pose major challengers for the diagnosis and prevention of mtDNA disease.
Figures
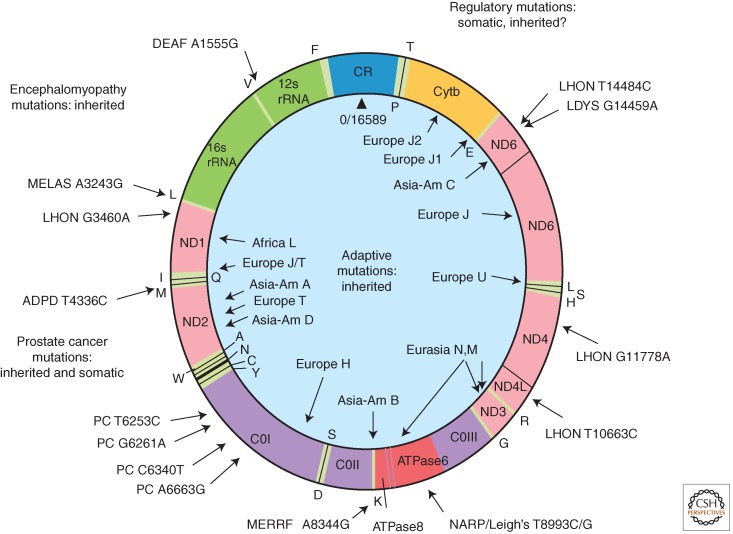
Human mitochondrial DNA map showing representative pathogenic and adaptive base substitution mutations. CR (control region) = D-loop. The letters around the outside perimeter or on the inside circle indicate cognate amino acids of the tRNA genes. Other gene symbols are defined in the text. Arrows followed by continental names and associated letters on the inside of the circle indicate the position of defining polymorphisms of selected region-specific mtDNA lineages. Arrows associated with abbreviations followed by numbers around the outside of the circle indicate representative pathogenic mutations, the number being the nucleotide position of the mutation. The full array of pathogenic mtDNA mutations and polymorphisms are available through Mitomap.org (MITOMAP 2012). DEAF, deafness; MELAS, mitochondrial encephalomyopathy, lactic acidosis, and stroke-like episodes; LHON, Leber hereditary optic neuropathy; ADPD, Alzheimer's disease and Parkinson's disease; MERRF, myoclonic epilepsy and ragged red fiber disease; NARP, neurogenic muscle weakness, ataxia, retinitis pigmentosum; LDYS, LHON + dystonia; PC, prostate cancer. (From Wallace 2007; reproduced, with permission, from the author.)
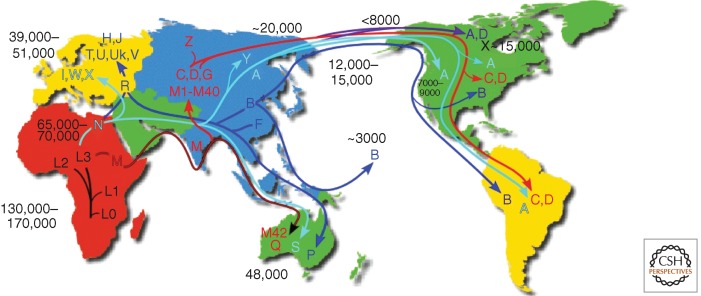
Diagram of the migratory history of the human mtDNA haplogroups. Homo sapiens mtDNAs arose in Africa ∼130,000–200,000 years before present (YBP), with the first African-specific haplogroup branch being L0, followed by the appearance in Africa of lineages L1, L2, and L3. In northeastern Africa, L3 gave rise to two new lineages, M and N. Only M and N mtDNAs successfully left Africa ∼65,000 YBP and colonized all of Eurasia and the Americas. In Eurasia and the Americas, M and N gave rise to a diverse array of mtDNA lineages designated macrohaplogroups M and N. The founders of macrohaplogroup M moved out of Africa through India and along the Southeast Asian coast down along the Malaysian peninsula and into Australia, generating haplogroups Q and M42 ∼48,000 YBP. Subsequently, M moved north out of Southeast Asia to produce a diverse array of Central Asian mtDNA lineages including haplogroups C, D, G, and many other M haplogroup lineages. In northeast Asia, haplogroup C gave rise to haplogroup Z. The founders of macrohaplogroup N also moved through Southeast Asia and into Australia, generating haplogroup S. In Asia, macrohaplogroup N mtDNAs also moved north to generate central Asian haplogroup A and Siberian haplogroup Y. In western Eurasia, macrohaplogroup N founders also moved north to spawn European haplogroups I, W, and X, and in western Eurasia, gave rise to submacrohaplogroup R. R moved west to produce the European haplogroups H, J, Uk, T, U, and V and also moved east to generate Australian haplogroup P and eastern Asian haplogroups F and B. By 20,000 YBP, mtDNA haplogroups C and D from M, and A from N, were enriched in northeastern Siberia and thus were positioned to migrate across the Bering land bridge (Beringia) to give rise to the first Native American populations, the Paleo-Indians. Haplogroups A, C, and D migrated throughout North America and on through Central America to radiate into South America. Haplogroup X, which is most prevalent in Europe but is also found in Mongolia though not in Siberia, arrived in North America ∼15,000 YBP but remained in northern North America. Haplogroup B, which is not found in Siberia but is prevalent along the coast of Asia, arrived in North America ∼12,000–15,000 YBP and moved through North and Central America and into South America, combining with A, C, D, and X to generate the five dominant Paleo-Indian haplogroups (A, B, C, D, X). A subsequent migration of haplogroup A out of the Chukotka peninsula ∼7000–9000 YBP gave rise to the Na-Déné (Athabaskins, Navajo, Apache, etc.). Subsequent movement across the Bering Strait, primarily carrying haplogroups A and D after 6000 YBP, produced the Eskimo and Aleut populations. Most recently, eastern Asian haplogroup B migrated south along the Asian coast through Micronesia and out into the Pacific to colonize all of the Pacific islands. Ages of migrations are approximated using mtDNA sequence evolution rates determined by comparing regional archeological or physical anthropological data with corresponding mtDNA sequence diversity. Because selection may have limited the accumulation of diversity in certain contexts, ages for regional migrations were estimated from the diversity encompassed within an individual regional or continental haplogroup lineages. This is because selection would have acted on the haplogroup mtDNA but most subsequent mutations would accumulate by random genetic drift and thus be “clock-like.” (From Wallace 2013a,; reproduced, with permission, from the author.)
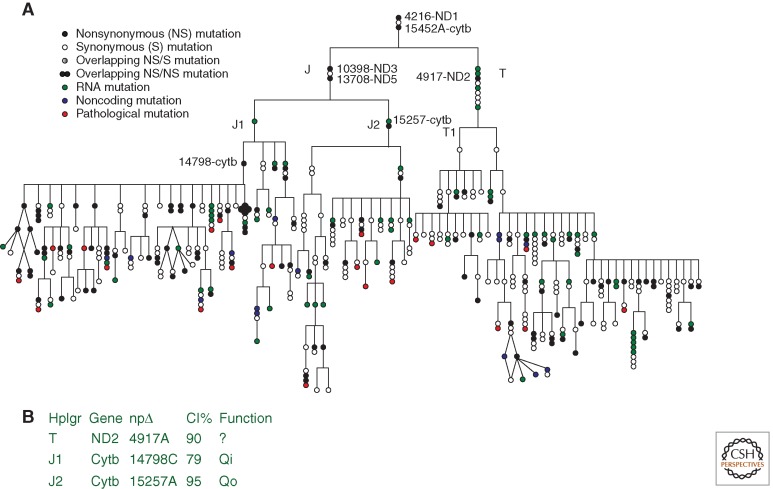
(A) Phylogeny of the haplogroups J and T demonstrating that each new branch of the mtDNA phylogeny is founded by a functionally significant polypeptide variant that is subsequently transmitted to all downstream descendants. Key internal replacement mutations are designated by the gene name and the nucleotide substitution. (B) The table provides function information and interspecific sequence conservation (conservation index = CI) for selected polymorphic amino acid sites. (From Ruiz-Pesini et al. 2004; reproduced, with permission, from the author and the American Association for the Advancement of Science © 2004.)
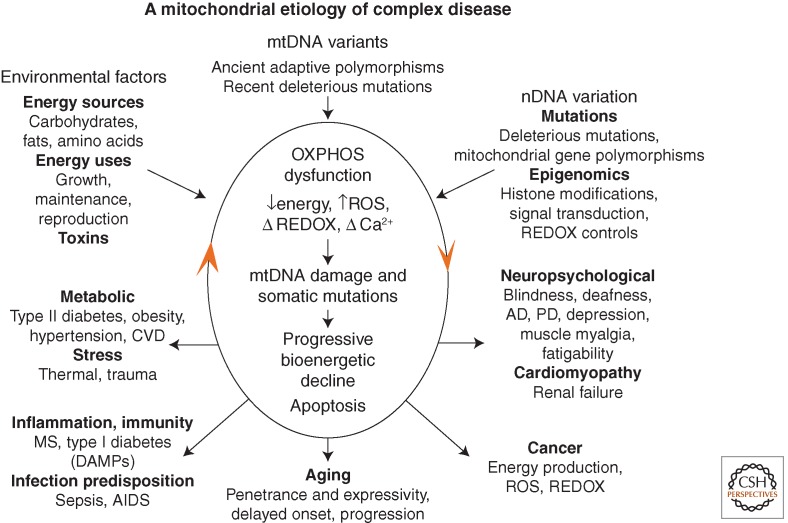
Integrated mitochondrial paradigm to explain the genetic and phenotypic complexities of metabolic and degenerative disease, aging, and cancer. The top three arrows show the three types of variation that impact on individual mitochondrial OXPHOS robustness and hence risk for developing disease symptoms. These include nuclear DNA (nDNA) variation encompassing DNA sequence changes and epigenomic modification of gene regulation and signal transduction pathways, mitochondrial DNA (mtDNA) variation including recent deleterious mutations and ancient adaptive polymorphisms, and environmental influences encompassing the availability and demand for calories and inhibition of mitochondrial function by environmental insults. The central oval encompasses the pathophysiological basis of disease processes and the basis of disease progression. The primary defect is reduction in the energy-transformation capacity of OXPHOS. This can result in reduced energy output, increased reactive oxygen species (ROS) production, altered REDOX status, and altered calcium homeostasis. The decline in OXPHOS efficiency can, in turn, perturb mitochondrial biogenesis, increase ROS production, impair mitophagy, etc., resulting in progressive increase in mtDNA damage and somatic mutations and further decline in mitochondrial function. Once mitochondrial function falls below the bioenergetic threshold of a tissue, symptoms ensue. Continued energetic failure can initiate cell destruction by apoptosis or necrosis. The lower five arrows summarize the disease categories and the phenotypic outcomes of perturbed mitochondrial energy transformation. The bottom arrow shows the effect of the stochastic accumulation of somatic mtDNA mutations resulting in delayed onset and a progressive course of diseases and aging. The right arrow indicates clinical problems that can result from reduced energy production in the most energetic tissues: the brain, heart, muscle, and kidney. The number and severity of symptoms in these organs reflect the degree and specific nature of the mitochondrial defect. The left arrow indicates the metabolic effects of mitochondrial dysfunction, which result in the perturbation of the body's energy balance. This results in the symptoms of the metabolic syndrome. The lower right arrow indicates that mitochondrial alterations are critical for cancer initiation, promotion, and metastasis. The lower left arrow outlines the hypothesized inflammatory and autoimmune responses that may result from the chronic introduction of the mitochondria's bacteria-like DNA and N-formylmethionine proteins into the bloodstream (Wallace 2011).
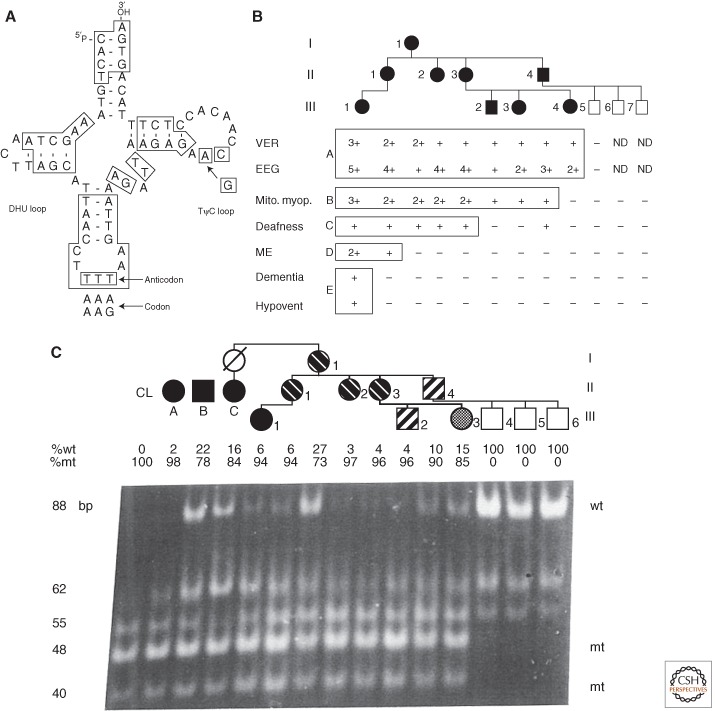
MERRF tRNALys A8344G pedigree showing variable clinical expression in association with variable mtDNA mutant heteroplasmy modified by age. (A) Structure of tRNALys showing position of A8344G transition in TΨC loop. (B) Pedigree of proband (III-1) showing that all maternal relatives had some clinical manifestations (filled symbols), though highly variable, while the three paternal sons were symptom free. VER, visual evoked response; EEG, electroencephalograph; Mito. myop., mitochondrial myopathy with ragged red fibers and abnormal mitochondria; deafness, sensory neural hearing loss; ME, myoclonic epilepsy; dementia, progressive cognitive decline; hypovent, hypoventilation. (C) Pedigree showing variable proportions of mutant-type (mt) and wild-type (wt) mtDNA along the maternal pedigree. A 183-nt PCR fragment was digested with CviJI. The wild-type (8344A) gave an 88-nt uncut fragment, whereas the mutant (8344G) created a new site cutting the 88-nt fragment into 48 and 40 nt fragments. “CL” is a cloned mutant fragment. Cases (A), (B), and (C) are independent pedigrees. Individual (C) is the maternal aunt of proband III-1 in (A), which manifested MERRF. All of the maternal relatives of the pedigree are heteroplasmic for the mutant mtDNA and the severity of the phenotype correlated with the percentage of heteroplasmy when corrected for age. (From Wallace et al. 1988b; reproduced, with permission, from the author and from Shoffner et al. 1990; reproduced, with permission, from the author and the National Academy of Sciences © 1990.)
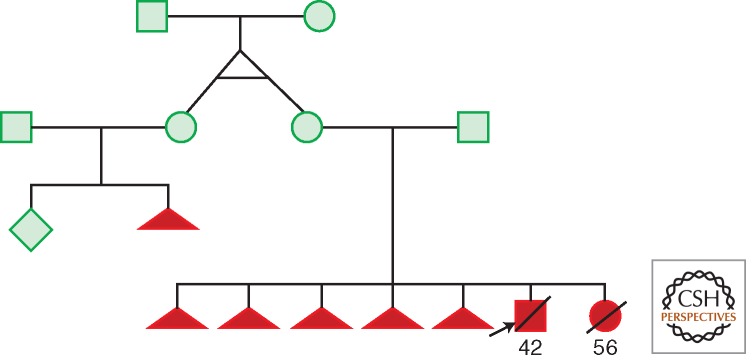
One published example of a germline lethal mtDNA mutation. A woman harboring a heteroplasmic mtDNA tRNAThr A15923G mutation lost five pregnancies in a row (triangles). The two surviving term infants died within 2 to 3 d. Postmortem mitochondrial analysis of one infant's skeletal muscle revealed that complex II + III and complex IV activities reduced to 6% and 5% of control and liver complex IV activity that was reduced 37% and complex II + III activity that was undetectable. The mother's twin sister had a similar reproductive history, yet both women were seemingly normal. (From Yoon et al. 1993; modified, with permission, from the authors.)
References
-
- Babu GJ, Feigelson ED 2006. Astrostatistics: Goodness-of-fit and all that! Astronomical Data Analysis Software and Systems XV ASP Conference Series 351: 127
-
- Ballinger SW, Shoffner JM, Hedaya EV, Trounce I, Polak MA, Koontz DA, Wallace DC 1992. Maternally transmitted diabetes and deafness associated with a 10.4 kb mitochondrial DNA deletion. Nat Genet 1: 11–15 - PubMed
-
- Ballinger SW, Shoffner JM, Gebhart S, Koontz DA, Wallace DC 1994. Mitochondrial diabetes revisited. Nat Genet 7: 458–459 - PubMed
Publication types
MeSH terms
Substances
Grants and funding
LinkOut - more resources
Full Text Sources
Other Literature Sources
Medical