. 2014 Mar 15;23(6):1579-90.
doi: 10.1093/hmg/ddt548. Epub 2013 Nov 1.

Major epigenetic development distinguishing neuronal and non-neuronal cells occurs postnatally in the murine hypothalamus

Affiliations

Major epigenetic development distinguishing neuronal and non-neuronal cells occurs postnatally in the murine hypothalamus

Ge Li et al. Hum Mol Genet. .

Abstract

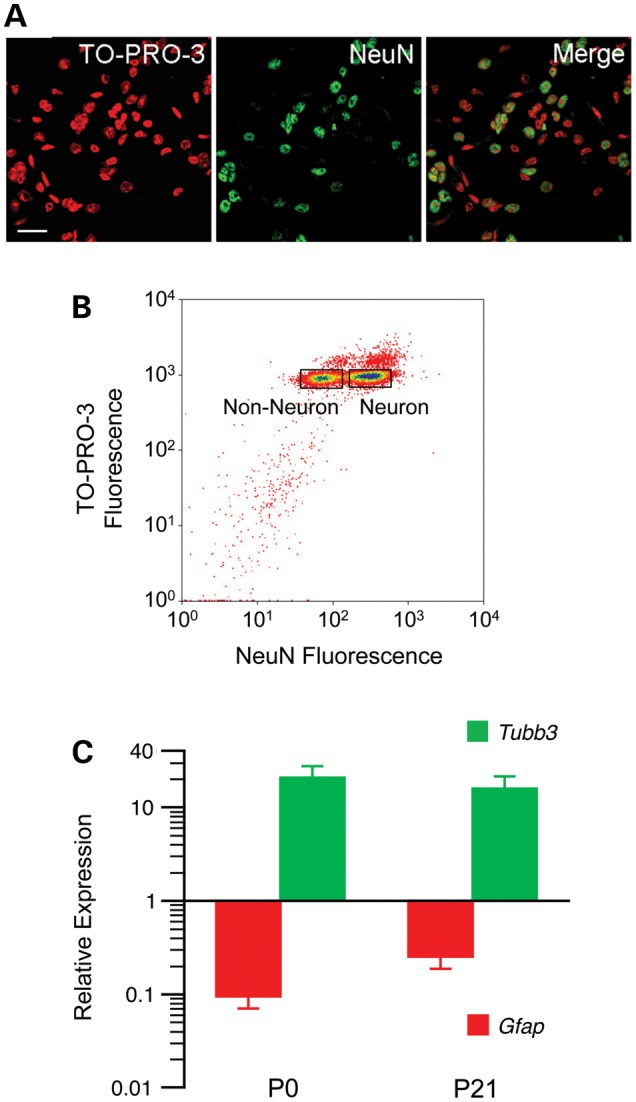
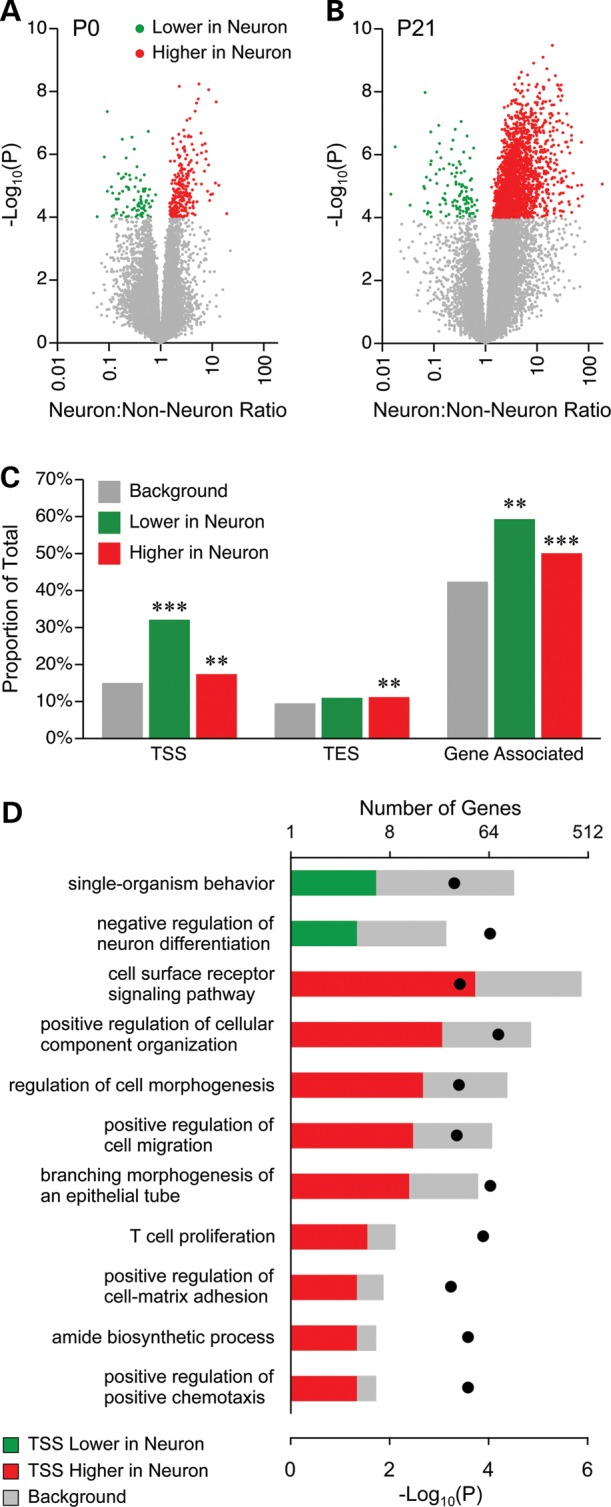
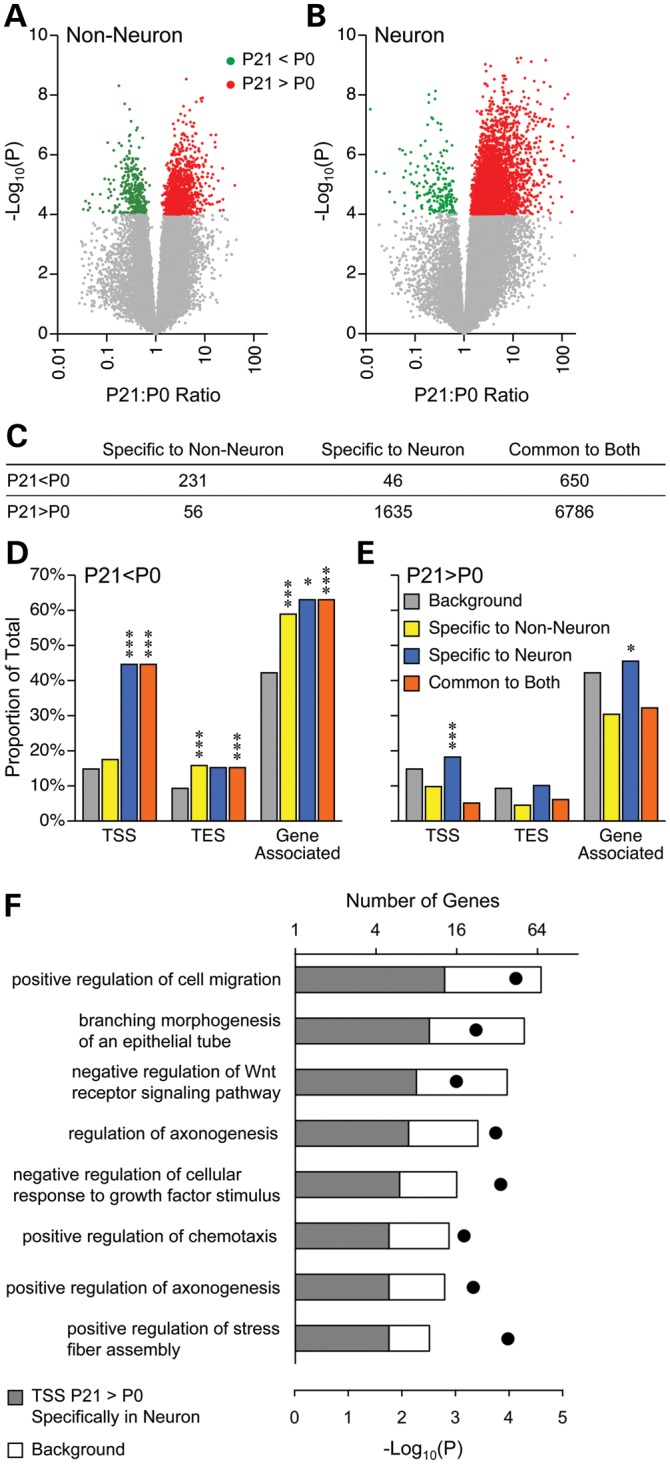
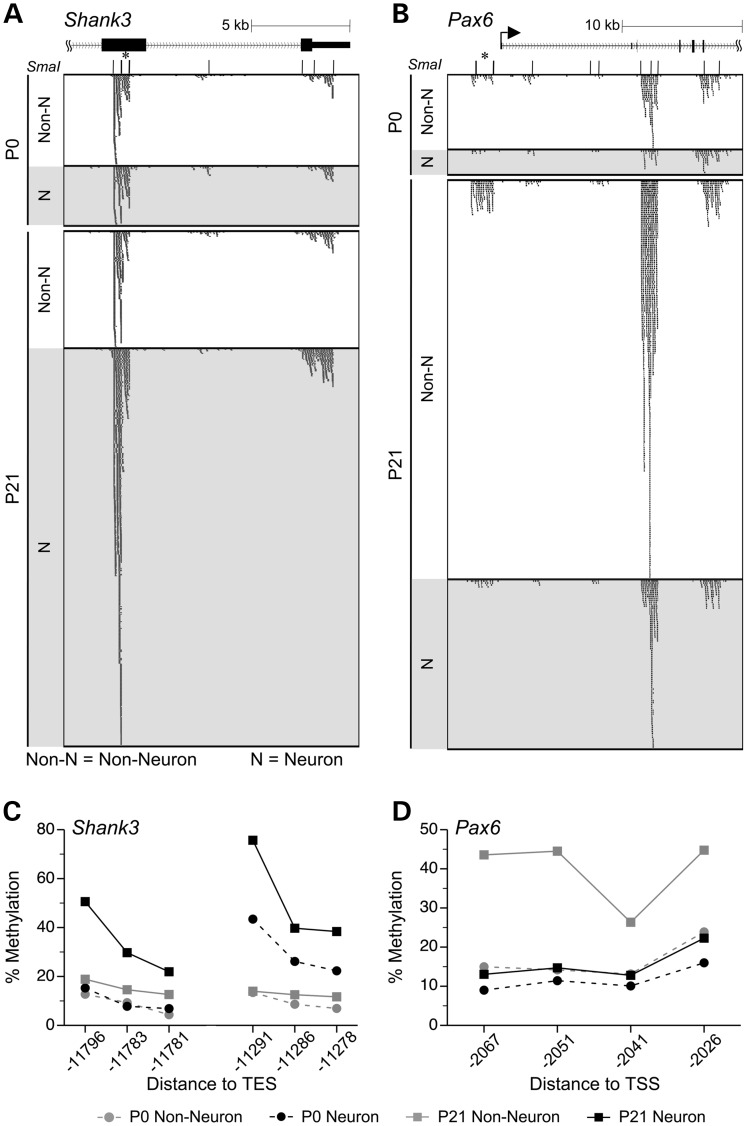
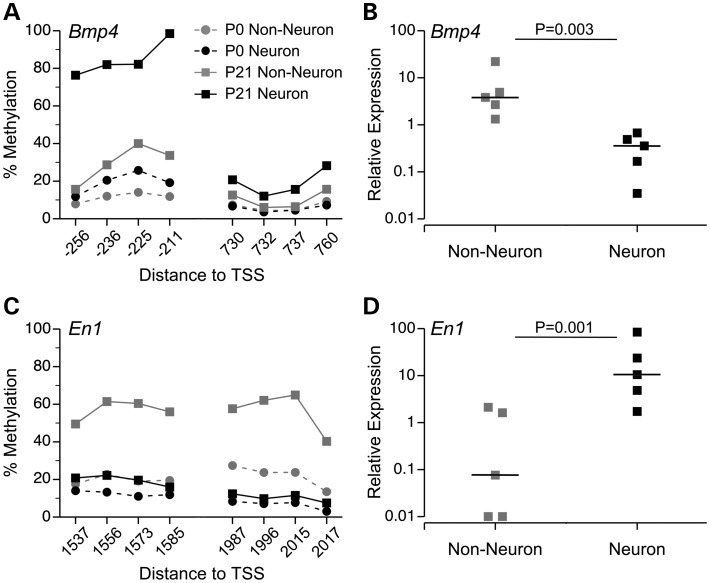
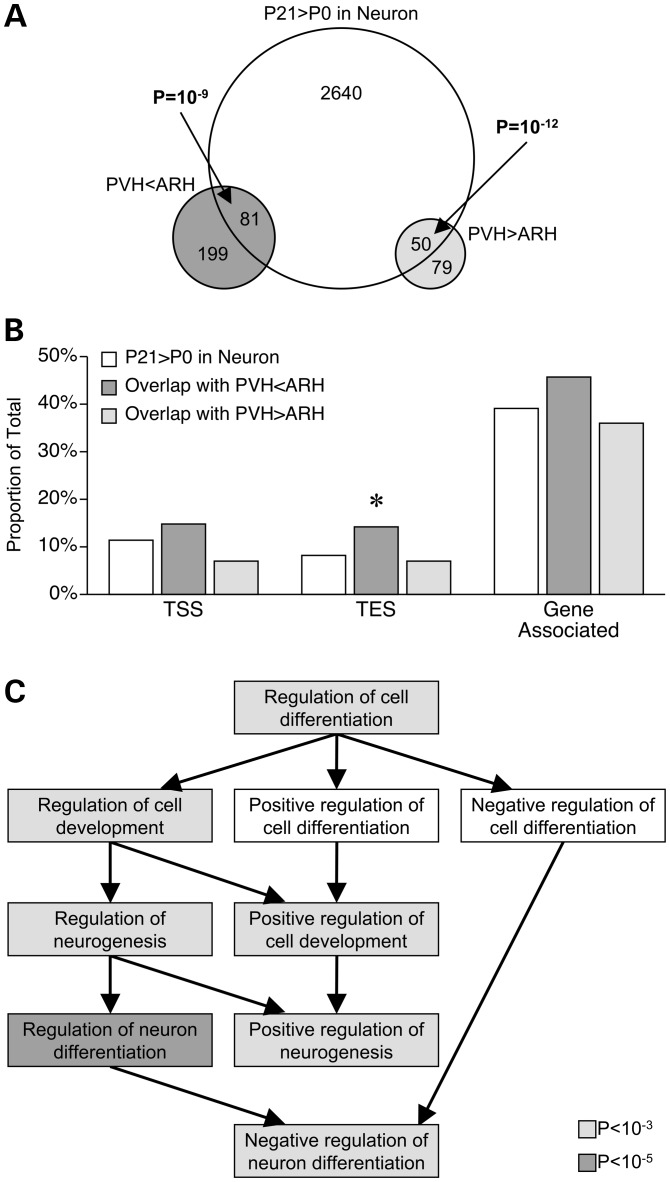
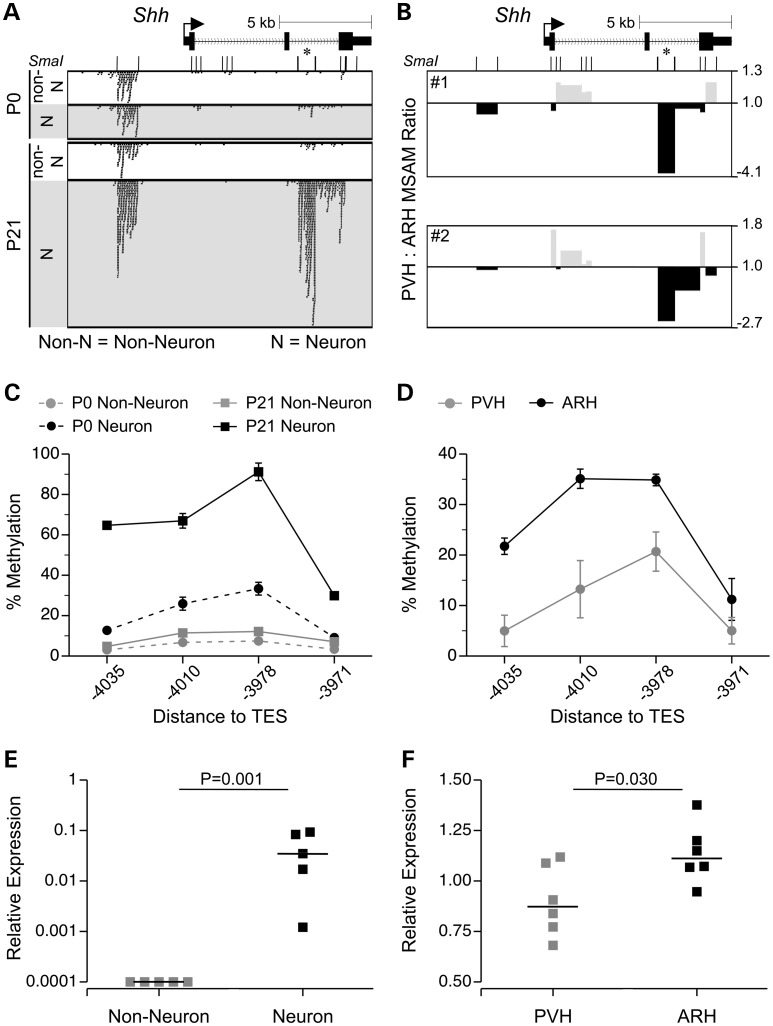
Prenatal and early postnatal environment can persistently alter one's risk of obesity. Environmental effects on hypothalamic developmental epigenetics constitute a likely mechanism underlying such 'developmental programming' of energy balance regulation. To advance our understanding of these processes, it is essential to develop approaches to disentangle the cellular and regional heterogeneity of hypothalamic developmental epigenetics. We therefore performed genome-scale DNA methylation profiling in hypothalamic neurons and non-neuronal cells at postnatal day 0 (P0) and P21 and found, surprisingly, that most of the DNA methylation differences distinguishing these two cell types are established postnatally. In particular, neuron-specific increases in DNA methylation occurred extensively at genes involved in neuronal development. Quantitative bisulfite pyrosequencing verified our methylation profiling results in all 15 regions examined, and expression differences were associated with DNA methylation at several genes. We also identified extensive methylation differences between the arcuate (ARH) and paraventricular nucleus of the hypothalamus (PVH). Integrating these two data sets showed that genomic regions with PVH versus ARH differential methylation strongly overlap with those undergoing neuron-specific increases from P0 to P21, suggesting that these developmental changes occur preferentially in either the ARH or PVH. In particular, neuron-specific methylation increases at the 3' end of Shh localized to the ARH and were positively associated with gene expression. Our data indicate a key role for DNA methylation in establishing the gene expression potential of diverse hypothalamic cell types, and provide the novel insight that early postnatal life is a critical period for cell type-specific epigenetic development in the murine hypothalamus.


Figures

Figure 1.
Figure 1.
Non-neuronal and neuronal nuclei were separated based on NeuN staining. (A) Representative photomicrographs illustrate the ability to discriminate neuronal and non-neuronal nuclei by NeuN staining. Scale bar indicates 25 µm. (B) Excellent discrimination of NeuN and NeuN+ nuclei was achieved by fluorescence-activated sorting. The rectangles indicate the gates set for sorting. (C) Expression levels of the neuron marker Tubb3 and astrocyte marker Gfap in NeuN+ nuclei confirm the quality of the separation at both ages (means ± SEM of four samples at each age).
Figure 2.
Figure 2.
Most cell type-specific DNA methylation is established postnatally. (A) Volcano plot of neuronal versus non-neuronal MSA-seq data at P0; each dot represents a SmaI/XmaI interval. Only a few SmaI/XmaI intervals show neuron versus non-neuron differences. (B) By P21, neurons are extensively hypermethylated relative to non-neuronal cells. (C) SmaI/XmaI sites showing DNA methylation differences at P21 are significantly associated with genes, particularly nearby TSS (**P < 0.01; ***P < 0.0001). (D) Genes with P21 neuron versus non-neuron differences at their TSS are associated with multiple GO processes related to neural development (P-values indicated by black dots). There were 4167, 40 and 278 genes in the background set, ‘lower in neurons’ and ‘higher in neurons’, respectively.
Figure 3.
Figure 3.
Cell type-specific DNA methylation changes associate with neuronal development. Volcano plots illustrating developmental methylation changes (P21 versus P0) in non-neuronal (A) and neuronal (B) cells; each dot presents a SmaI/XmaI interval. (C) The vast majority of methylation changes were common to both cell types. Changes specific to non-neuronal cells were mostly decreases, and neuron-specific methylation changes were almost entirely increases. (D) Methylation decreases were strongly enriched nearby TSS, TES and within genes. (E) Only methylation increases specific to neurons were enriched near genes, predominantly at TSS (*P < 0.01; ***P < 0.0001; for simplicity, significance is indicated only for enrichment, not depletion). (F) Genes with neuron-specific methylation increases at their TSS are associated with multiple GO processes related to neural development (P-values indicated by black dots). There were 4167 and 233 genes in the background set and ‘neuron specific increase’, respectively.
Figure 4.
Figure 4.
DNA methylation changes detected by MSA-seq were validated by bisulfite pyrosequencing. (A) Near the 3′ end of Shank3, 4 SmaI/XmaI intervals spanning ∼10 kb showed concordant DNA methylation increases specifically in neurons. (B) At the 5′ of Pax6, 3 SmaI/XmaI intervals spanning >10 kb showed concordant DNA methylation increase in non-neurons. [In panels (A) and (B), asterisks indicate the SmaI/XmaI intervals that were significant by MSA-seq and selected for verification]. The DNA methylation increase specific to neurons at Shank3 (C) and the decrease specific to non-neuronal cells at Pax6 (D) were validated by bisulfite pyrosequencing. In panels (C) and (D), DNA methylation percentages are presented as means ± SEM of n = 5 per age per cell type (error bars smaller than symbols); line breaks indicate multiple pyrosequencing assays.
Figure 5.
Figure 5.
DNA methylation differences are associated with gene expression. (A) At the Bmp4 TSS, a methylation increase specific to neurons was validated by bisulfite pyrosequencing. (B) Consistent with this, Bmp4 is down-regulated in neuronal relative to non-neuronal cells at P21. (C) Downstream of the En1 TSS, a methylation increase specific to non-neuronal cells was validated by bisulfite pyrosequencing. (D) En1 is down-regulated in non-neuronal cells relative to neurons at P21. In panels (A) and (C) DNA methylation data are presented as means ± SEM (n = 5 per age per cell type; error bars smaller than symbols). In (B) and (D) each square indicates relative expression of a single sample, and the horizontal bars indicate the median values.
Figure 6.
Figure 6.
Neuronal DNA methylation changes localize to specific hypothalamic nuclei. (A) SmaI/XmaI intervals with differential DNA methylation in PVH versus ARH overlap significantly with those gaining methylation from P0 to P21 in neurons. (B) SmaI/XmaI sites showing both PVH < ARH and neuronal methylation increases are significantly enriched nearby TES (*P < 0.05). (C) These TES-associated genes are enriched for GO processes related to neuronal differentiation.
Figure 7.
Figure 7.
Neuron-specific methylation increases at the Shh 3′ CGI are localized to the ARH and positively associated with gene expression. (A) Upstream of the Shh TES, 3 SmaI/XmaI intervals exhibited concordant neuron-specific methylation increases (the asterisk indicates the SmaI/XmaI interval that was significant by MSA-seq). (B) This same interval was found to be hypermethylated in ARH relative to PVH, by MSAM. (C) The neuron-specific methylation increase was validated by bisulfite pyrosequencing (means ± SEM, n = 5). (D) ARH versus PVH hypermethylation was validated by bisulfite pyrosequencing (means ± SEM, n = 3; each sample = 7 mice). (E) At P21, Shh expression is higher in neurons than in non-neuronal cells (n = 5). (F) At P21, Shh expression is higher in ARH than in PVH (n = 6). In both (E) and (F), horizontal bars indicate the medians.

References

    1. Atkinson R.L., Pietrobelli A., Uauy R., Macdonald I.A. Are we attacking the wrong targets in the fight against obesity?: the importance of intervention in women of childbearing age. Int. J. Obes. (Lond) 2012;36: 1259–1260. - PubMed
    1. Gluckman P.D., Hanson M., Zimmet P., Forrester T. Losing the war against obesity: the need for a developmental perspective. Sci. Trans. Med. 2011;3 1–4. - PubMed
    1. Gluckman P.D., Hanson M.A., Buklijas T., Low F.M., Beedle A.S. Epigenetic mechanisms that underpin metabolic and cardiovascular diseases. Nat. Rev. Endocrinol. 2009;5:401–408. - PubMed
    1. Waterland R.A., Garza C. Potential mechanisms of metabolic imprinting that lead to chronic disease. Am. J. Clin. Nutr. 1999;69:179–197. - PubMed
    1. Jaenisch R., Bird A. Epigenetic regulation of gene expression: how the genome integrates intrinsic and environmental signals. Nat. Genet. 2003;33(Suppl):245–254. - PubMed

Publication types