. 2013 Dec 20;288(51):36703-16.
doi: 10.1074/jbc.M113.504381. Epub 2013 Nov 1.

Development of functionally selective, small molecule agonists at kappa opioid receptors

Affiliations

Development of functionally selective, small molecule agonists at kappa opioid receptors

Lei Zhou et al. J Biol Chem. .

Abstract

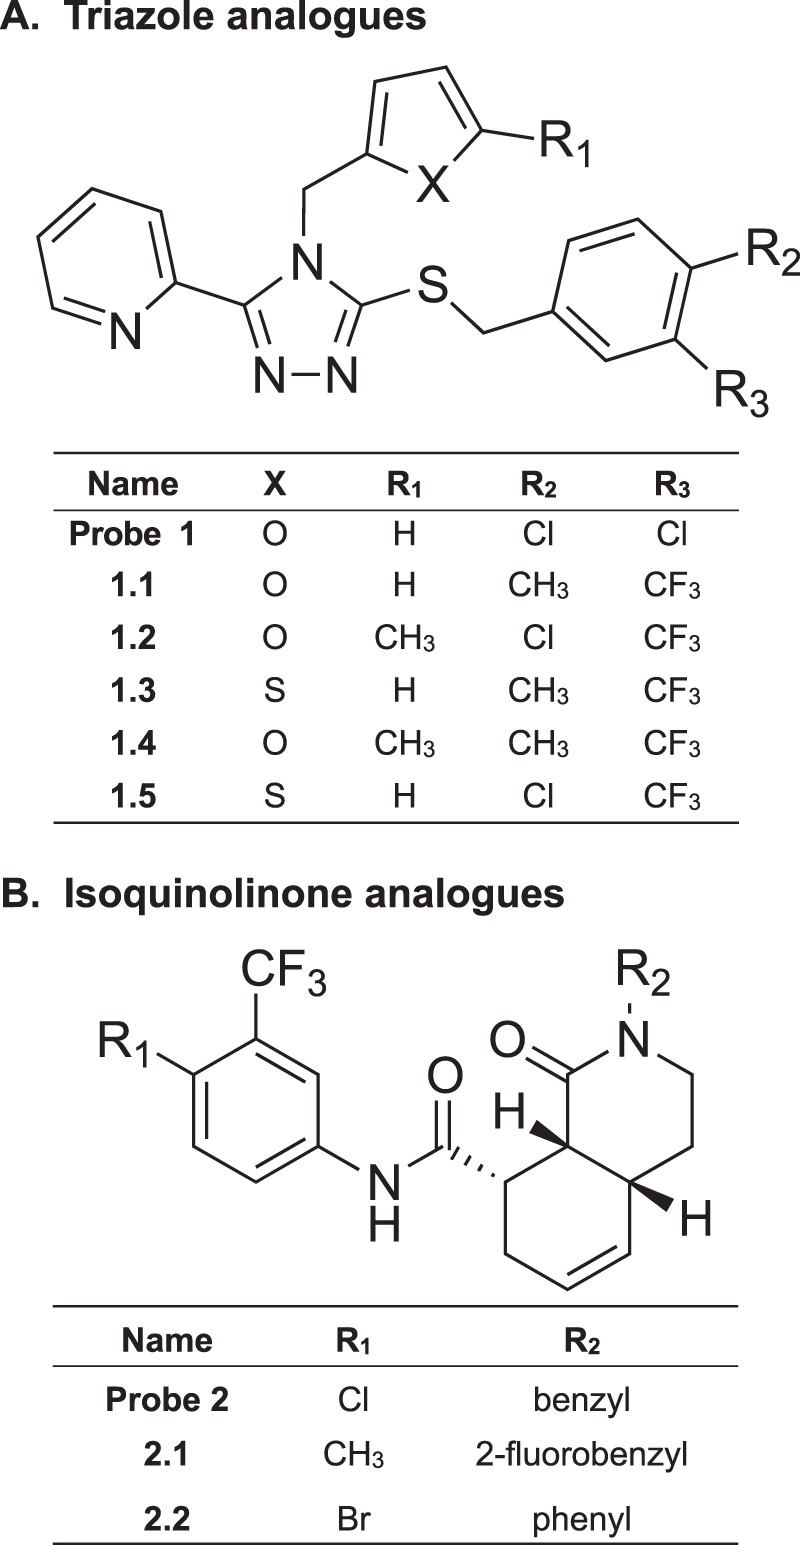
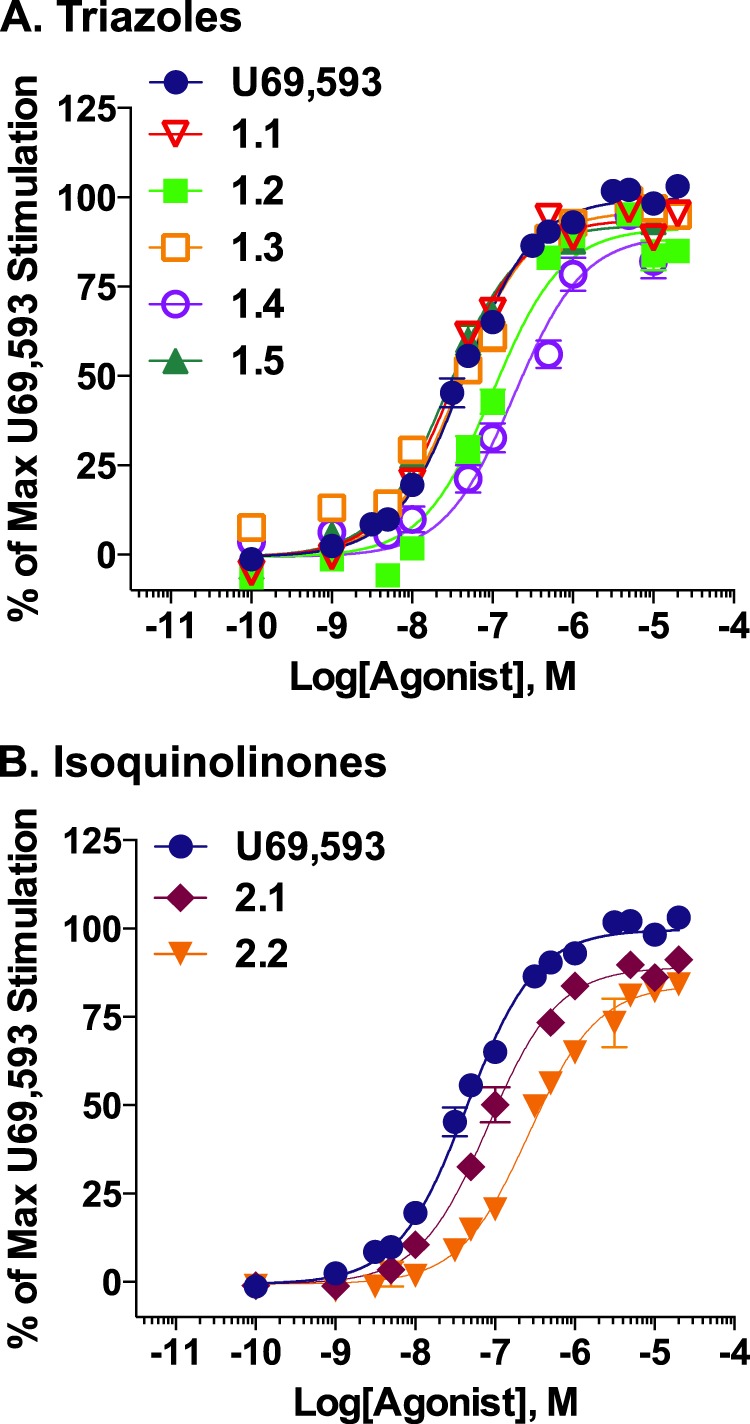
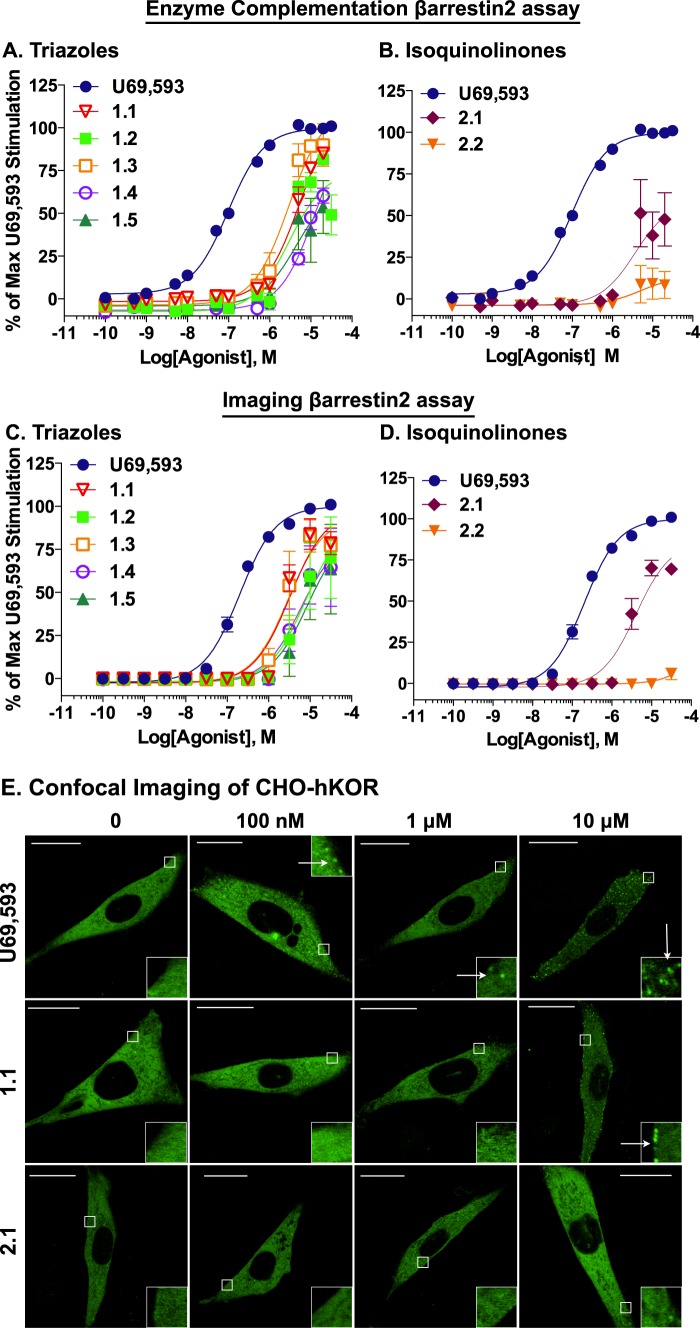
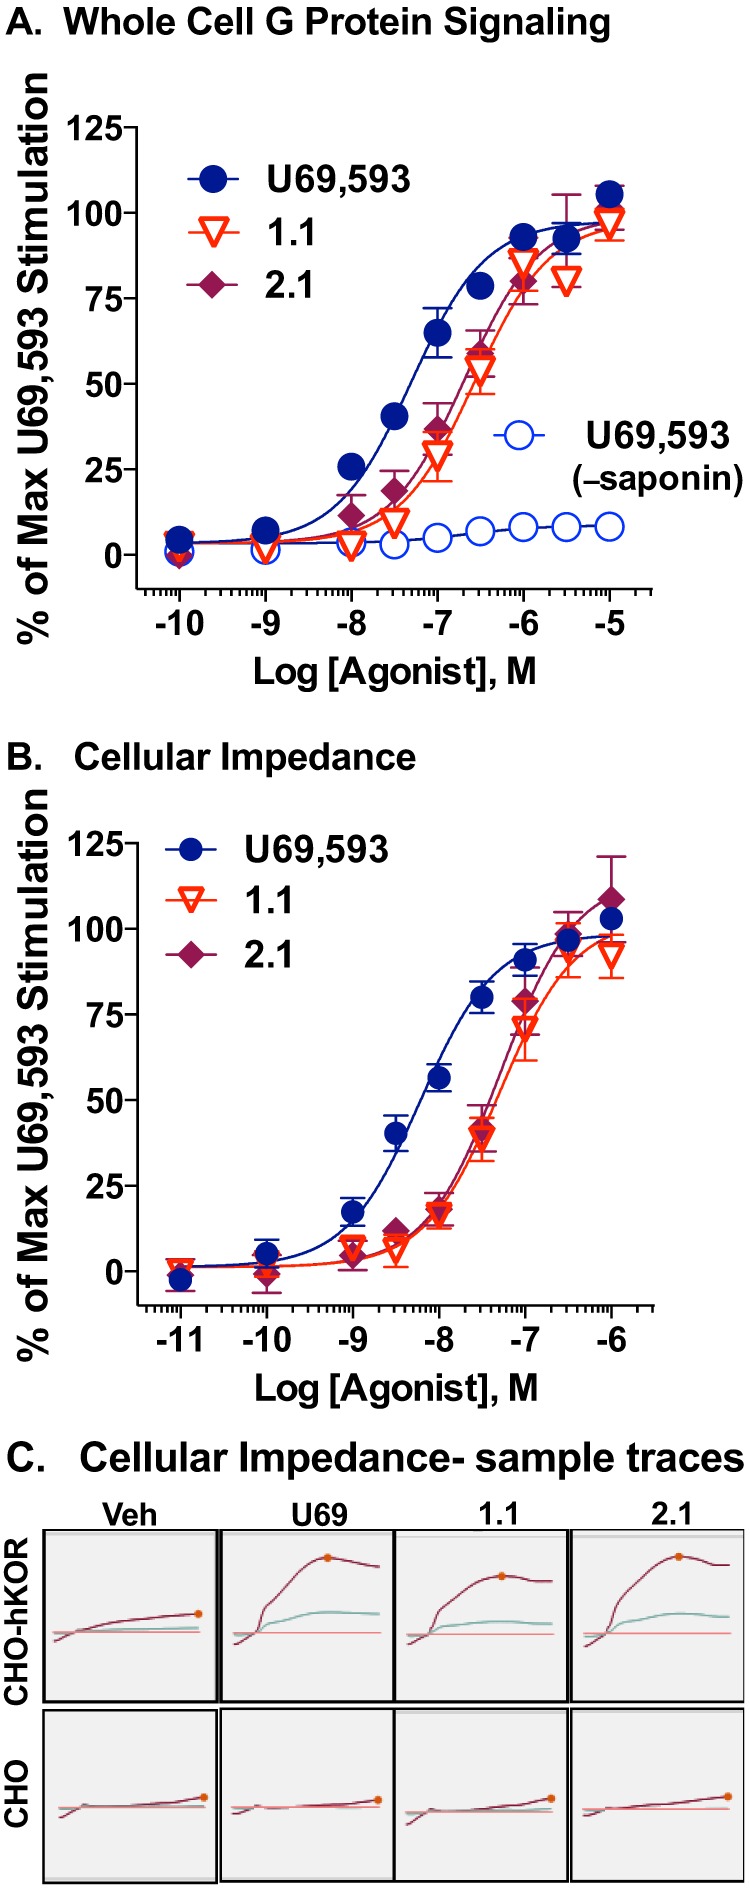
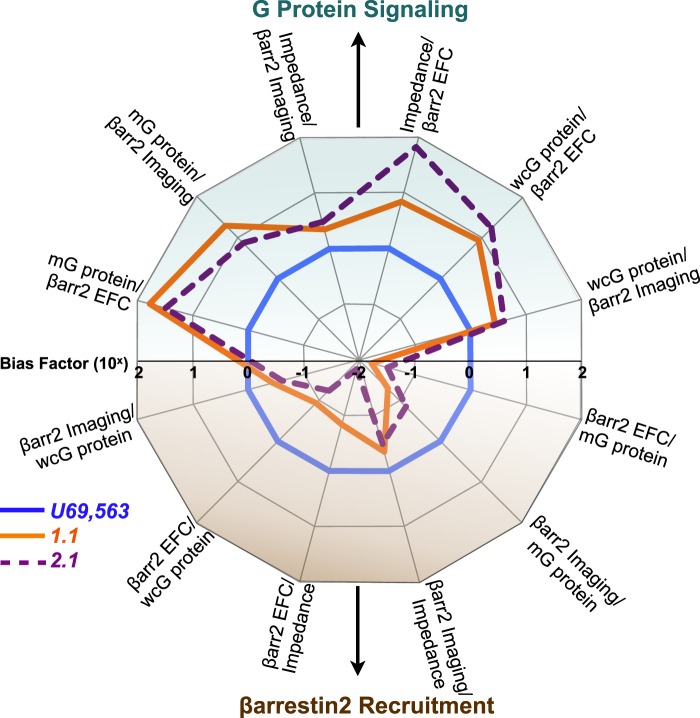
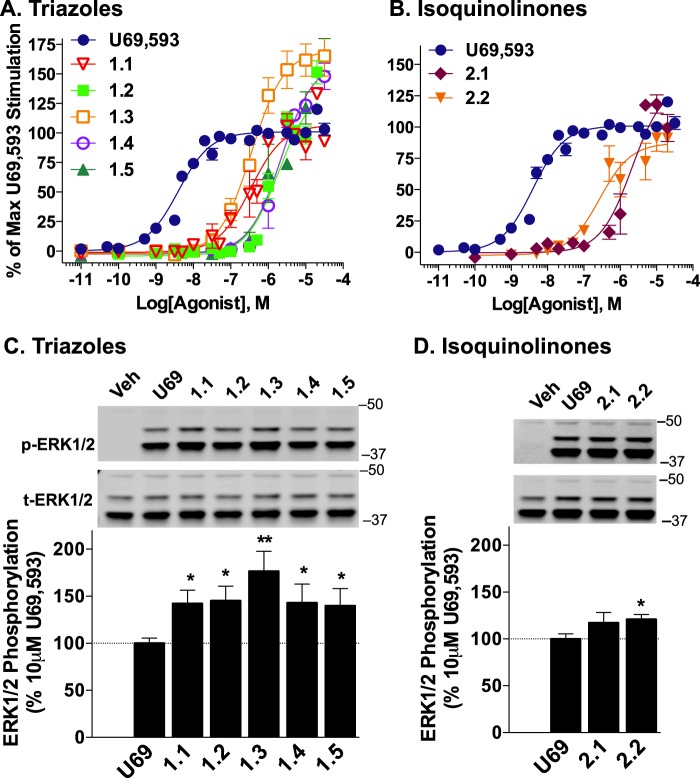
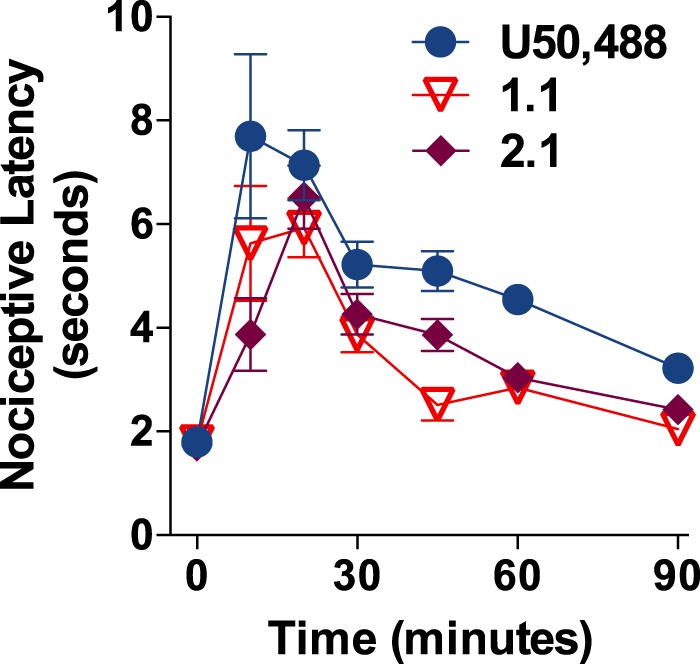
The kappa opioid receptor (KOR) is widely expressed in the CNS and can serve as a means to modulate pain perception, stress responses, and affective reward states. Therefore, the KOR has become a prominent drug discovery target toward treating pain, depression, and drug addiction. Agonists at KOR can promote G protein coupling and βarrestin2 recruitment as well as multiple downstream signaling pathways, including ERK1/2 MAPK activation. It has been suggested that the physiological effects of KOR activation result from different signaling cascades, with analgesia being G protein-mediated and dysphoria being mediated through βarrestin2 recruitment. Dysphoria associated with KOR activation limits the therapeutic potential in the use of KOR agonists as analgesics; therefore, it may be beneficial to develop KOR agonists that are biased toward G protein coupling and away from βarrestin2 recruitment. Here, we describe two classes of biased KOR agonists that potently activate G protein coupling but weakly recruit βarrestin2. These potent and functionally selective small molecule compounds may prove to be useful tools for refining the therapeutic potential of KOR-directed signaling in vivo.

Keywords: Arrestin; Brain; Drug Discovery; Dysphoria; ERK; G Protein-coupled Receptors (GPCR); Kappa Opioid Receptor; Opiate Opioid; Pain.


Figures

FIGURE 1.
FIGURE 1.
Structure of KOR agonists. A, triazole probes (PubChem compound ID 44601470) were reported to have binding affinity for KOR (Ki = 2.4 nm) over MOR (Ki = 1900 nm) and DOR (Ki = 5351 nm) (36). Analogues of the triazole probe are shown. B, isoquinolinone probe and analogues were reported to have binding affinity to KOR (Ki = 5 nm) over MOR (Ki = 3550 nm) and DOR (Ki > 10 μm) (38).
FIGURE 2.
FIGURE 2.
Triazole analogues (A) and isoquinolinone analogues (B) are potent, full agonists in membrane [35S]GTPγS binding assays. CHO-hKOR cell membrane preparations were incubated with increasing concentrations of indicated agonists in the presence of [35S]GTPγS; activity is calculated as percentage of maximal U69,593 stimulation following base-line subtraction. Calculated potencies and efficacies are presented in Table 1. Data are presented as the mean ± S.E. (n ≥ 3).
FIGURE 3.
FIGURE 3.
Compared with U69,593, the triazole and isoquinolinone analogues are weak agonists for βarrestin2 recruitment to KOR. Concentration-response curves of triazole analogues (A) and isoquinolinone analogues (B) in the commercial EFC assay or the high content imaging assay (C, triazoles and D, isoquinolinones) reveal that these compounds lead to βarrestin2 recruitment at low potencies compared with U69,593. Calculated potencies and efficacies are presented in Table 1. Data are presented as the mean ± S.E. E, representative images of CHO-hKOR cells expressing βarrestin2-YFP treated with U69,593, 1.1, or 2.1. U69,593 robustly recruits βarrestin2 at 100 nm and 1 and 10 μm, inducing green fluorescent punctae formation. 1.1 does not induce green fluorescent punctae formation at 100 nm and 1 μm, although βarrestin2 recruitment becomes apparent at 10 μm. 2.1 does not recruit βarrestin2-YFP even at 10 μm dose. Insets: 4× magnifications showing the βarrestin2-YFP punctae (arrows). Scale bars, 20 μm.
FIGURE 4.
FIGURE 4.
Triazole and isoquinolinone KOR agonists are potent, full agonists in whole cell G protein signaling assays. A, whole cell G coupling assay. CHO-hKOR cells were permeabilized prior to performing agonist-stimulated [35S]GTPγS binding assays directly on plated cells in 96-well plates. Activity is calculated as percentage of maximal U69,593 stimulation following base-line subtraction. U69,593 induces no stimulation in the absence of permeabilization (−saponin). B, cellular impedance assay. Changes in cellular impedance in CHO-hKOR cells were recorded for 35 min after treatment of increasing doses of U69,593, 1.1 and 2.1. Maximal changes in impedance are calculated as percentage of maximal U69,593 (U69) stimulation. C, example traces comparing vehicle (Veh) and the maximum dose of 1 μm of each compound are shown (bottom). Calculated potencies and efficacies for both assays are presented in Table 3. Data are presented as the mean ± S.E. (n ≥ 5).
FIGURE 5.
FIGURE 5.
Triazole and isoquinolinone agonists bias KOR toward G protein signaling pathways. Transduction efficiencies presented in Tables 2 and 3 for G protein signaling assays and βarrestin2 recruitment assays were used to calculate bias factors. Bias factors are presented in Tables 2 and 3 and are plotted here on a logarithmic scale (base 10). As the reference agonist, the bias of U69,593 conforms to unity in all assays. The pathways represented are as follows: membrane [35S]GTPγS binding (mG protein); βarr2 EFC, βarr2 imaging, cellular impedance, and whole cell [35S]GTPγS binding (wcG protein). Independent of the platform used to assess G protein signaling or βarrestin2 recruitment, both 1.1 and 2.1 display bias for G protein signaling.
FIGURE 6.
FIGURE 6.
Ligands induced ERK1/2 phosphorylation in CHO-hKOR cells. A, CHO-hKOR cells were treated with increasing doses of triazole (A) and isoquinolinone analogues (B) for 10 min, and phosphorylated (p-ERK) and total ERK (t-ERK) were detected by fluorescence intensity in 96-well plate “In-cell Western” assays. The ratio of p-ERK1/2 to total ERK1/2 was calculated and reported normalized to the percentage of maximal response induced by U69,593. C and D, Western blot analysis confirms that the p42 and p44 bands increase with drug treatment when examined with the p-ERK1/2 antibody. The high degree of ERK1/2 phosphorylation in CHO-hKOR cells induced by the triazole (C) or isoquinolinone (D) stimulation exceeds that observed for U69,593 (U69) (10 μm, 10 min), confirming the observations made in the In-cell Western format. Ratios of p-ERK1/2 over total ERK1/2 were normalized to the maximal U69,593 stimulation observed (n ≥ 3; *, p < 0.05; **, p < 0.01, Student's t test); molecular masses are indicated in kDa. Veh, vehicle.
FIGURE 7.
FIGURE 7.
Compounds 1.1 and 2.1 induce antinociceptive effects in mice. C57BL/6J male mice were treated with U50,488H, 1.1, or 2.1 at 30 mg/kg, and intraperitoneal and tail withdrawal response latencies were recorded in response to exposure of the tail to warm water (49 °C) at 10, 20, 30, 45, 60, and 90 min post-treatment. Data are presented as the mean ± S.E. U50,488H and both test compounds induced similar time-dependent antinociceptive responses (one-way ANOVA, for U50,488H, F(6,49) = 5.58, p < 0.0001; for 1.1, F(6,49) = 10.55, p < 0.0001; for 2.1, F(6,49) = 13.42, p < 0.0001; Bonferroni's post test, basal versus treatment time within each drug treatment: U50,488H (10, 20 min, p < 0.001; 30, 45 min, p < 0.01; 60 min, p < 0.05) and 1.1 (10, 20 min, p < 0.001; 30, 45 min, p < 0.05), 2.1 (20, 30 min, p < 0.001, 10; 45 min, p < 0.01) n = 8–10 mice per drug treatment).
FIGURE 8.
FIGURE 8.
Schematic of isoquinolinone and triazole compound signaling at KOR compared with U69,593. Activation at KOR mediates multiple signaling cascades leading to G protein coupling, βarrestin recruitment, and ERK kinase phosphorylation. The isoquinolinones and triazoles act as biased agonists, preferentially inducing G protein coupling over βarrestin2 recruitment. This lack of preference for βarrestin2 recruitment appears to correlate with a loss in potency for ERK1/2 activation. Because KOR-mediated antinociception has been attributed to G protein signaling mechanisms and because KOR-induced interactions with βarrestin2 are proposed to induce dysphoria, biasing KOR activation toward G protein signaling and away from βarrestin2 pathways may be the key to induce antinociception and avoid dysphoria (30, 57, 58).

References

    1. Cox B. M. (2013) Recent developments in the study of opioid receptors. Mol. Pharmacol. 83, 723–728 - PubMed
    1. Chavkin C., James I. F., Goldstein A. (1982) Dynorphin is a specific endogenous ligand of the kappa opioid receptor. Science 215, 413–415 - PubMed
    1. Mansour A., Fox C. A., Burke S., Meng F., Thompson R. C., Akil H., Watson S. J. (1994) Mu, delta, and kappa opioid receptor mRNA expression in the rat CNS: an in situ hybridization study. J. Comp. Neurol. 350, 412–438 - PubMed
    1. Minami M., Satoh M. (1995) Molecular biology of the opioid receptors: structures, functions and distributions. Neurosci. Res. 23, 121–145 - PubMed
    1. Prather P. L., McGinn T. M., Claude P. A., Liu-Chen L. Y., Loh H. H., Law P. Y. (1995) Properties of a kappa-opioid receptor expressed in CHO cells: interaction with multiple G-proteins is not specific for any individual Gα subunit and is similar to that of other opioid receptors. Brain Res. Mol. Brain Res. 29, 336–346 - PubMed

Publication types