. 2013 Dec 27;288(52):36796-809.
doi: 10.1074/jbc.M113.480251. Epub 2013 Nov 1.

The structure of integrin α1I domain in complex with a collagen-mimetic peptide

Affiliations

The structure of integrin α1I domain in complex with a collagen-mimetic peptide

Yanni K-Y Chin et al. J Biol Chem. .

Abstract

We have determined the structure of the human integrin α1I domain bound to a triple-helical collagen peptide. The structure of the α1I-peptide complex was investigated using data from NMR, small angle x-ray scattering, and size exclusion chromatography that were used to generate and validate a model of the complex using the data-driven docking program, HADDOCK (High Ambiguity Driven Biomolecular Docking). The structure revealed that the α1I domain undergoes a major conformational change upon binding of the collagen peptide. This involves a large movement in the C-terminal helix of the αI domain that has been suggested to be the mechanism by which signals are propagated in the intact integrin receptor. The structure suggests a basis for the different binding selectivity observed for the α1I and α2I domains. Mutational data identify residues that contribute to the conformational change observed. Furthermore, small angle x-ray scattering data suggest that at low collagen peptide concentrations the complex exists in equilibrium between a 1:1 and 2:1 α1I-peptide complex.

Keywords: Collagen; Extracellular Matrix; Integrins; NMR; Protein Structure; Protein-Protein Interactions.


Figures

FIGURE 1.
FIGURE 1.
HSQC spectra of the titration of α1I with GLOGEN peptide. A, overlay of the 1H,15N TROSY of unliganded α1I (red) and a 1:2 complex of α1I bound to GLOGEN (black) showing significant chemical shift perturbations. The samples contained 2H,15N,13C-labeled α1I (400 μm) in the presence and absence of GLOGEN (800 μm). The spectra were acquired at 600 MHz and 293 K. B–D, 1H,15N SOFAST HMQC spectra of 1H,15N-labeled α1I (100 μm) with no GLOGEN (B) and GLOGEN:α1I at a ratio of 1:1 (C) and 3:1 (D). NMR spectra were acquired at 800 MHz and 293 K. The spectral quality declined during the early stage of GLOGEN titration but was gradually recovered as excess peptide was titrated into the system.
FIGURE 2.
FIGURE 2.
Theoretical and experimental T1/T2 ratios for αI domain-peptide complexes. The theoretical T1/T2 of the unliganded α1I (red) matches with the experimentally determined T1/T2 of the unliganded α1I sample (blue). The T1/T2 of the GLOGEN-bound α1I (cyan) was determined with a sample containing a 2-fold excess of GLOGEN. The experimental data are consistent with theoretical data for a 1:1 GLOGEN-α1I complex (gold). The theoretical T1/T2 ratios for the 2:1 complex of α1I-GLOGEN (black) are significantly different, suggesting that the 1:1 complex dominates under the experimental conditions. Residues 283–293 and the C terminus of GLOGEN-bound α1I show a marked decrease in T1/T2, suggesting that these are flexible regions of the protein.
FIGURE 3.
FIGURE 3.
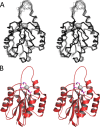
The solution structure α1I bound to GLOGEN. A, stereoviews of the backbone of the 20 lowest energy structures of α1I with the Mg2+ ion shown as a gray sphere. B, a schematic of the lowest energy structure in the ensemble with the Mg2+ shown as a gray sphere. The residues that coordinate the Mg2+ ion, Ser152, Ser154, and Thr220, are highlighted as magenta sticks.
FIGURE 4.
FIGURE 4.
Effects of GLOGEN binding on α1I. A, TALOS+-predicted S2 value for the unliganded (red) and GLOGEN-bound (black) α1I based on the NMR chemical shifts. S2, the angular order parameter, describes the rigidity of a residue as a measure of its backbone conformational entropy. It ranges between 0 for a completely disordered residue and 1 for a rigid residue. Significant drops at the βE-α6 loop (uncoiled from C helix) and at the C terminus in the bound state indicate a gain in flexibility in these regions of α1I upon GLOGEN binding. B, 1H,15N NOE measurements for the unliganded (red) and GLOGEN-bound α1I (black). The low values for residues in the βE-α6 loop and at the C terminus are consistent with increased flexibility in the presence of GLOGEN. C, percentage of signal intensity loss in the 1H,15N TROSY spectrum as a consequence of peptide binding. Residues with cross-peaks that lost more than 70% intensity are highlighted in red. D, weighted chemical shift perturbations measured in the TROSY spectra highlighted regions (highlighted with gray bars across the other panels) that were most significantly influenced by peptide binding. Regions with the largest CSPs include the three MIDAS loops, βE-α6 loop, and helix 7, which is distant from the MIDAS but for which a 12-Å downward displacement was observed in the structure. E and F, aligned structures with these regions highlighted for the unliganded (red; Protein Data Bank code 1QCY) and GLOGEN-bound (black) α1I domain. E shows a zoomed image of the C helix, which is uncoiled in the liganded structure. The spheres represent the Mg2+ ions. In F, the salt bridge formed between residue Glu317 and Arg287 in the unliganded (red) or Arg171 in the liganded (black) states is indicated as a black dotted line.
FIGURE 5.
FIGURE 5.
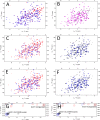
NMR analysis of α1I mutants. Overlaid spectra of 1H,15N-labeled WT (red) and R171A (blue) α1I (A) and WT α1I (black) and R171A (magenta) α1I (B) both in the presence of GLOGEN are shown. The similarity of the WT and R171A spectra in both their unliganded and GLOGEN-bound states suggests that the R171A mutation had little effect on peptide binding. C, unliganded WT (red) and R287A (blue) α1I. D, WT α1I with GLOGEN (black) and unliganded R287A α1I (blue). The spectrum of the unliganded R287A mutant showed a greater degree of similarity to the peptide-bound state of WT α1I, suggesting that the unbound state of the R287A mutant adopts a conformation that is more similar to the activated state of the WT α1I. E, unliganded WT (red) and E317A (blue) α1I. F, WT α1I with GLOGEN (black) and unliganded E317A α1I (blue). The spectrum of the unliganded E317A was also more similar to the spectrum of the peptide-bound state of WT α1I, suggesting that the E317A also adopts a similar conformation. G and H, zoomed regions of the TROSY spectra highlighting residue Ile331 in unliganded WT α1I (red), GLOGEN-bound WT α1I (black), and unliganded R287A (blue) (G) or E317A (blue) (H). NMR spectra were acquired at 800 MHz and 293 K.
FIGURE 6.
FIGURE 6.
Chemical shift perturbations observed in R287A and E317A. Schematic representations of the peptide-bound state of α1I highlighting the residues for which chemical shift perturbations were observed between the spectrum of GLOGEN-bound WT α1I and R287A (red) (A) or E317A (blue) (B) are shown. Arg287 and Glu317 are shown in stick representation.
FIGURE 7.
FIGURE 7.
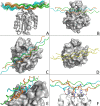
HADDOCK-calculated structure of the α1I-GLOGEN complex. A, schematic representation of a cluster of 10 conformers of the α1I-GLOGEN complex. The Mg2+ ion is shown as a gray sphere. The three strands of the triple-helical collagen peptide, referred to as the leading, middle, and trailing strands, are shown in cyan, orange, and green, respectively. B and C, the lowest energy conformer in the cluster of the α1I-GLOGEN complex. GLOGEN binds across a surface trench in the α1I. D, crystal structure of the α2I-GFOGER peptide complex (Protein Data Bank code 1DZI) with the three peptide strands of the collagen peptide shown in yellow. The orientation of α2I in D was aligned with the α1I in C for clear comparison of the binding orientation of the two peptides. In α2I, the peptide bound along the edge of the surface trench. E and F, close-up of the MIDAS of the lowest energy conformer of the α1I-GLOGEN complex. The middle strand contains the glutamate residue that coordinates with the Mg2+. Residues that are involved in polar interactions are shown as sticks. Only the middle and leading strands showed specific interactions with α1I. Note that the asparagine from the leading strand is accommodated in a surface pocket next to the Mg2+ ion (E).
FIGURE 8.
FIGURE 8.
Elution profile of α1I in the absence (red) and presence (black) of GLOGEN on an analytical size exclusion column. In the red trace, the peak at 11.68 ml represents unliganded α1I, whereas the peak at 10.02 ml observed in the presence of GLOGEN corresponds to a much larger species. Comparison of the elution volume with albumin (67 kDa) and ovalbumin (44 kDa) revealed that the complex is likely to have a molecular mass greater than the 27 kDa expected for a 1:1 GLOGEN-α1I complex.
FIGURE 9.
FIGURE 9.
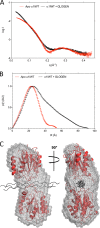
SAXS model of α1I and GLOGEN-α1I complex. A, plot of SAXS diffraction intensity versus q for the samples containing α1I alone (red) and α1I with GLOGEN (black). Error bars indicate ±1 S.D. B, Porod analysis on the data acquired for the samples containing α1I alone (red) and α1I with GLOGEN (black). C, alignment of the model of the dimeric α1I-GLOGEN complex with the ab initio SAXS envelope. The model consists of two α1I molecules (red) and one triple-helical peptide (black). The two α1I molecules were orientated so that the Mg2+ ions at the MIDAS are coordinated by glutamate residues from two of the three peptide strands. The SAXS envelope (shown in gray grid) shows a slightly bent but elongated shape, which fits well with the dimeric model even though the envelope is unable to fit the two ends of the peptide. AU, arbitrary units.

References

    1. Hynes R. O. (2002) Integrins: bidirectional, allosteric signaling machines. Cell 110, 673–687 - PubMed
    1. Gullberg D. E., Lundgren-Akerlund E. (2002) Collagen-binding I domain integrins—what do they do? Prog. Histochem. Cytochem. 37, 3–54 - PubMed
    1. Gullberg D. E. (ed) (2003) I Domains in Integrins, pp. 25–57, Landes Bioscience, Georgetown, TX
    1. Eble J. A. (2005) Collagen-binding integrins as pharmaceutical targets. Curr. Pharm. Des. 11, 867–880 - PubMed
    1. Vanderslice P., Woodside D. G. (2006) Integrin antagonists as therapeutics for inflammatory diseases. Expert Opin. Investig. Drugs 15, 1235–1255 - PubMed

Publication types

Associated data

LinkOut - more resources