. 2013 Oct 21:7:137.
doi: 10.3389/fncom.2013.00137. eCollection 2013.

Physical principles for scalable neural recording

Affiliations

Physical principles for scalable neural recording

Adam H Marblestone et al. Front Comput Neurosci. .

Abstract

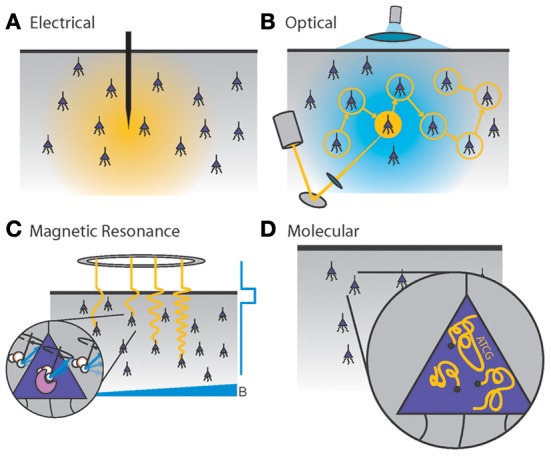
Simultaneously measuring the activities of all neurons in a mammalian brain at millisecond resolution is a challenge beyond the limits of existing techniques in neuroscience. Entirely new approaches may be required, motivating an analysis of the fundamental physical constraints on the problem. We outline the physical principles governing brain activity mapping using optical, electrical, magnetic resonance, and molecular modalities of neural recording. Focusing on the mouse brain, we analyze the scalability of each method, concentrating on the limitations imposed by spatiotemporal resolution, energy dissipation, and volume displacement. Based on this analysis, all existing approaches require orders of magnitude improvement in key parameters. Electrical recording is limited by the low multiplexing capacity of electrodes and their lack of intrinsic spatial resolution, optical methods are constrained by the scattering of visible light in brain tissue, magnetic resonance is hindered by the diffusion and relaxation timescales of water protons, and the implementation of molecular recording is complicated by the stochastic kinetics of enzymes. Understanding the physical limits of brain activity mapping may provide insight into opportunities for novel solutions. For example, unconventional methods for delivering electrodes may enable unprecedented numbers of recording sites, embedded optical devices could allow optical detectors to be placed within a few scattering lengths of the measured neurons, and new classes of molecularly engineered sensors might obviate cumbersome hardware architectures. We also study the physics of powering and communicating with microscale devices embedded in brain tissue and find that, while radio-frequency electromagnetic data transmission suffers from a severe power-bandwidth tradeoff, communication via infrared light or ultrasound may allow high data rates due to the possibility of spatial multiplexing. The use of embedded local recording and wireless data transmission would only be viable, however, given major improvements to the power efficiency of microelectronic devices.

Keywords: brain activity mapping; electrical recording; embedded electronics; magnetic resonance imaging; molecular recording; neural recording; optical methods.


Figures

Figure 1
Figure 1
Four generalized neural recording modalities. (A) Extracellular electrical recording probes the voltage due to nearby neurons. (B) Optical microscopy detects light emission from activity-dependent indicators. In two-photon laser scanning microscopy, shown here, an excitation beam at 2× the peak excitation wavelength of the fluorescent indicator is scanned across the sample, while an integrating detector captures the emitted fluorescence. (C) Magnetic resonance imaging detects radio-frequency magnetic induction signals from aqueous protons, after weak thermal alignment of the proton spins by a static magnetic field. A resonant radio-frequency pulse tips the spins into a plane perpendicular to the static field, causing the net magnetization to precess. The resulting signals are affected by the local chemical and magnetic environment, which can be altered dynamically by imaging agents in response to neural activity. Activity-dependent contrast agents are necessary to transduce neural activity into an MRI readout, whereas current functional MRI methods rely on blood oxygenation signals which cannot reach single-neuron resolution. (D) Molecular recording devices have been proposed, in which a “ticker tape” - record of neural activity is encoded in the monomer sequence of a biomolecular polymer – a form of nano-scale local data storage. This could be achieved by coupling correlates of neural activity to the nucleotide misincorporation probabilities of a DNA or RNA polymerase as it replicates or transcribes a known DNA strand.
Figure 2
Figure 2
Penetration depth (attenuation length) of electromagnetic radiation in water vs. wavelength [data from Jonasz (2007)]. The approximate diameter of the mouse brain is shown as a black dashed line. Inset: approximate tissue model based on Mie scattering theory and water absorption. Absorption length of water (Kou et al., 1993) (blue), approximate tissue scattering length in a simple Mie scattering model (red) and the resulting attenuation length (green) of infrared light [inset reproduced from Horton et al. (2013), with permission].
Figure 3
Figure 3
The voltage signal to interference-plus-noise ratio (SINR) for neurons immediately adjacent to the recording site sets an approximate upper bound on the distance, rmax, between the recording site and the farthest neuron it can sense (blue), due to the exponential falloff of the voltage SINR with distance. Assuming at least one electrode per cube of edge length 233rmax in turn limits the number of neurons per recording site (gold), the total number of recording sites (red) and the maximal diameter of wiring consistent with <1% total brain volume displacement (turquoise). SINR values for current recording setups are <102. In practice, the number of neurons per electrode distinguishable by current spike sorting algorithms is only ~10, with an estimated information theoretic limit of ~100, so these curves greatly under-estimate the number of electrodes which would be required based on realistic spike sorting approaches in a pure voltage-sensing scenario.
Figure 4
Figure 4
Energy cost of elementary operations across a variety of recording and data transmission modalities, expressed in units of the thermal energy (left axis) and as a power assuming 100 GHz switching rate (right axis). The Landauer limit of kB T ln 2 sets the minimum energy associated with a logically irreversible bit flip. The practical limit will likely lie in the tens of kB T per bit (Yablonovitch, 2008), comparable to the free energy release for hydrolysis of a single ATP molecule (or addition of a single nucleotide to DNA or RNA). The energy of a single infrared photon is ~50 kB T. Single gates in current CMOS chips dissipate ~1×10⁵–106kB T per switching event, including the capacitive charging of the wires interconnecting the gates (red curve). The switching energy for the gate, not including wires, is ~100× lower (blue curve). The power efficiency of CMOS has been on an exponential improvement trend due to the miniaturization of components according to Moore's law [data re-digitized from Tucker and Hinton (2011)], although power efficiency gains have slowed recently. Current RFID chips compute and communicate at ~1×10⁹–1010kB T (>10 pJ) per bit transmitted, while the total energy cost per floating point operation in a 2010 laptop was ~1×10¹²kBT. The power associated with a minimal low-noise CMOS analog front end for signal amplification corresponds to ~500 mW at whole mouse brain scale. A single two-photon laser pulse at 0.1 nJ pulse energy corresponds to ~1×1010kB T. For comparison, the 40 mW approximate maximal allowed power dissipation, according to Section 2 above, with its equivalent per-bit energy of ~1×108kB T at the minimal 100 Gbit/s bit rate.
Figure 5
Figure 5
Power requirements imposed by information theory on data transmission through a single (additive white Gaussian noise) channel with carrier frequency ν (an upper bound on the bandwidth), given thermal noise and path loss. Bottom: absorption length of water as a function of frequency (blue), minimal power to transmit data at 100, 1000, and 10,000 Gbit/s (green) as a function of frequency, assuming thermal noise but no path loss. Top: minimal power to transmit data at 100, 1000 and 10,000 Gbit/s as a function of frequency, assuming thermal noise and a path loss corresponding to the attenuation by water absorption over a distance of 2 mm. While formulated for a single channel, at certain wavelengths (e.g., RF) these factors also constrain multiplexed data transmissions between many transmitters and many receivers, depending on capacity of the system for spatial multiplexing. Horizontal dashed lines: 40 mW, the approximate maximal whole-brain power dissipation in steady state.
Figure 6
Figure 6
Key factors determining the spatiotemporal resolution of dynamic MRI imaging. (A) Temporal resolution and contrast agent concentration allowing >5% contrast, for different classes of dynamic MRI contrast agent [reproduced from Shapiro et al. (2006), with permission]. (B) Diffusion limited spatial resolution for water proton MRI as a function of temporal resolution.

References

    1. Ahmad S., Akdoan E. K. (eds.) (2008). Piezoelectric and Acoustic Materials for Transducer Applications. Boston, MA: Springer; Available online at: http://www.amazon.com/dp/0387765387
    1. Abrahamsson S., Chen J., Hajj B., Stallinga S., Katsov A. Y., Wisniewski J., et al. (2012). Fast multicolor 3d imaging using aberration-corrected multifocus microscopy. Nat. Methods 10, 60–63 10.1038/nmeth.2277 - DOI - PMC - PubMed
    1. Ahrens M. B., Orger M. B., Robson D. N., Li J. M., Keller P. J. (2013). Whole-brain functional imaging at cellular resolution using light-sheet microscopy. Nat. Methods 10, 413–420 10.1038/nmeth.2434 - DOI - PubMed
    1. Akemann W., Sasaki M., Mutoh H., Imamura T., Honkura N., Knöpfel T. (2013). Two-photon voltage imaging using a genetically encoded voltage indicator. Sci. Rep. 3 10.1038/srep02231 - DOI - PMC - PubMed
    1. Alivisatos A. P., Andrews A. M., Boyden E. S., Chun M., Church G. M., Deisseroth K., et al. (2013). Nanotools for neuroscience and brain activity mapping. ACS Nano 7, 1850–1866 10.1021/nn4012847 - DOI - PMC - PubMed