

PD-L1 expression induced by the 2009 pandemic influenza A(H1N1) virus impairs the human T cell response
- PMID: 24187568
- PMCID: PMC3803123
- DOI: 10.1155/2013/989673
PD-L1 expression induced by the 2009 pandemic influenza A(H1N1) virus impairs the human T cell response
Abstract
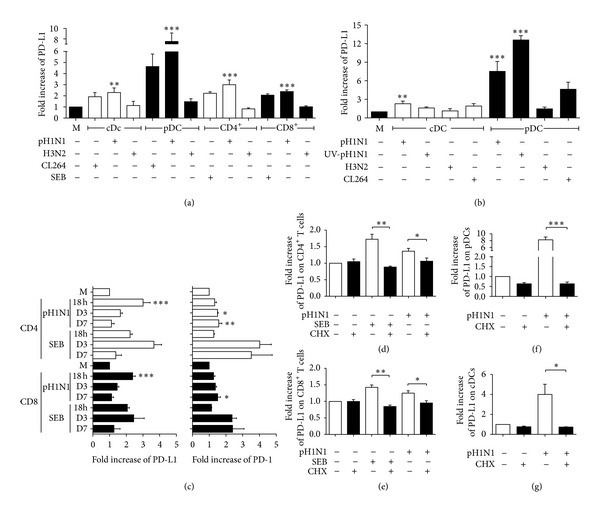
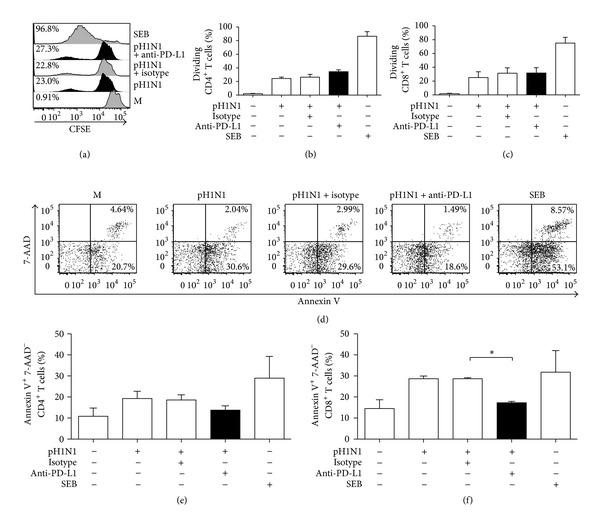
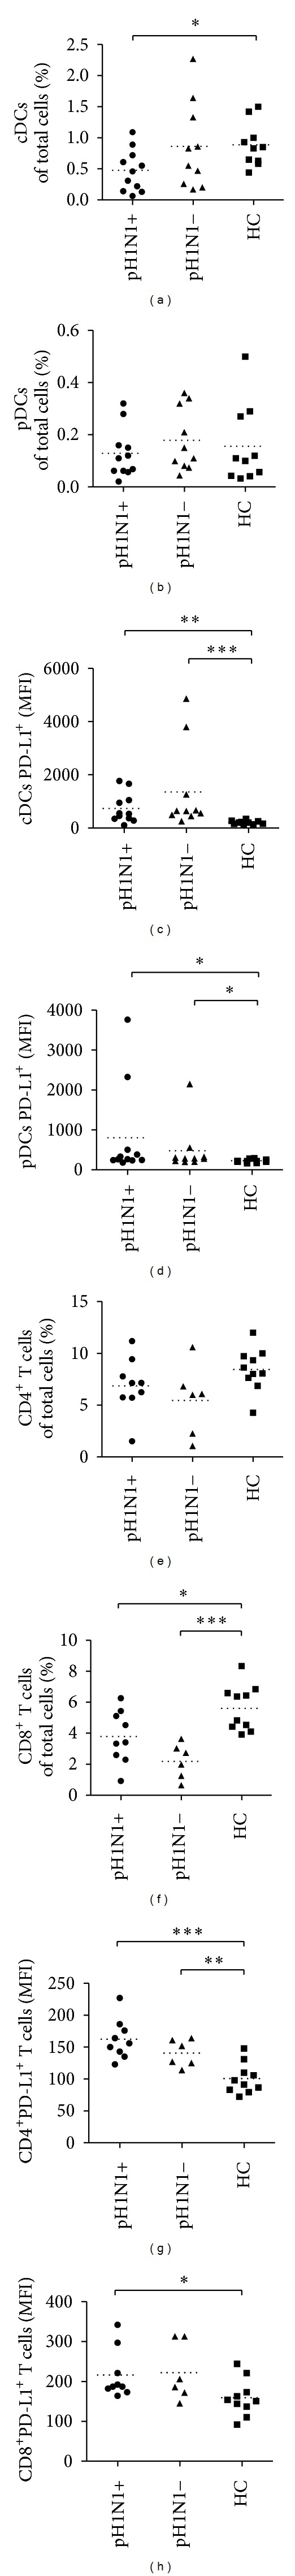
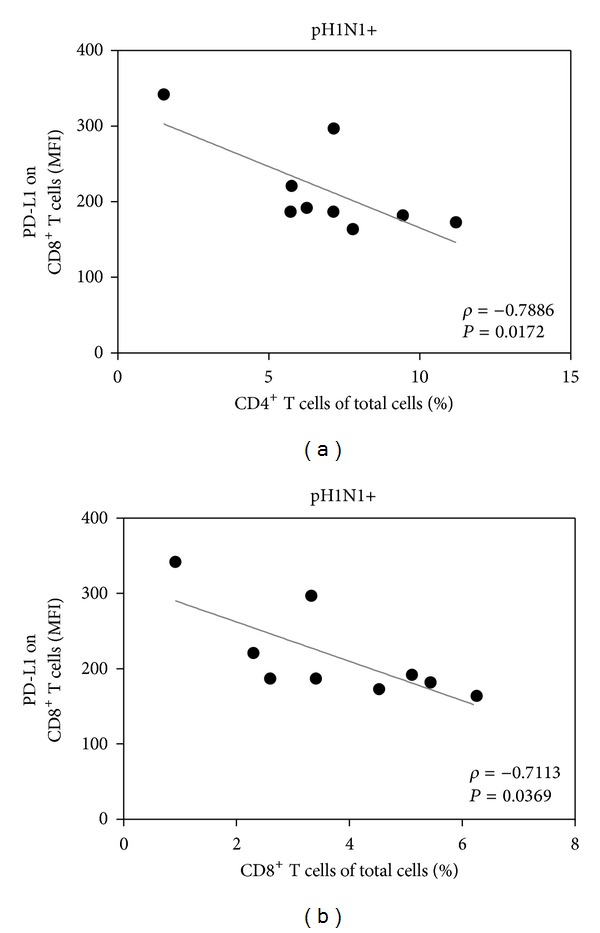
PD-L1 expression plays a critical role in the impairment of T cell responses during chronic infections; however, the expression of PD-L1 on T cells during acute viral infections, particularly during the pandemic influenza virus (A(H1N1)pdm09), and its effects on the T cell response have not been widely explored. We found that A(H1N1)pdm09 virus induced PD-L1 expression on human dendritic cells (DCs) and T cells, as well as PD-1 expression on T cells. PD-L1 expression impaired the T cell response against A(H1N1)pdm09 by promoting CD8⁺ T cell death and reducing cytokine production. Furthermore, we found increased PD-L1 expression on DCs and T cells from influenza-infected patients from the first and second 2009 pandemic waves in Mexico City. PD-L1 expression on CD8⁺ T cells correlated inversely with T cell proportions in patients infected with A(H1N1)pdm09. Therefore, PD-L1 expression on DCs and T cells could be associated with an impaired T cell response during acute infection with A(H1N1)pdm09 virus.
Figures

Similar articles
-
Human T-cells directed to seasonal influenza A virus cross-react with 2009 pandemic influenza A (H1N1) and swine-origin triple-reassortant H3N2 influenza viruses.J Gen Virol. 2013 Mar;94(Pt 3):583-592. doi: 10.1099/vir.0.048652-0. Epub 2012 Nov 14. J Gen Virol. 2013. PMID: 23152369
-
Highly Predictive Model for a Protective Immune Response to the A(H1N1)pdm2009 Influenza Strain after Seasonal Vaccination.PLoS One. 2016 Mar 8;11(3):e0150812. doi: 10.1371/journal.pone.0150812. eCollection 2016. PLoS One. 2016. PMID: 26954292 Free PMC article.
-
Low expression of activation marker CD69 and chemokine receptors CCR5 and CXCR3 on memory T cells after 2009 H1N1 influenza A antigen stimulation in vitro following H1N1 vaccination of HIV-infected individuals.Hum Vaccin Immunother. 2015;11(9):2253-65. doi: 10.1080/21645515.2015.1051275. Epub 2015 Jun 19. Hum Vaccin Immunother. 2015. PMID: 26091502 Free PMC article.
-
Non-neutralizing antibodies induced by seasonal influenza vaccine prevent, not exacerbate A(H1N1)pdm09 disease.Sci Rep. 2016 Nov 16;6:37341. doi: 10.1038/srep37341. Sci Rep. 2016. PMID: 27849030 Free PMC article.
-
Differential Immune Profiles in Two Pandemic Influenza A(H1N1)pdm09 Virus Waves at Pandemic Epicenter.Arch Med Res. 2015 Nov;46(8):651-8. doi: 10.1016/j.arcmed.2015.12.003. Epub 2015 Dec 13. Arch Med Res. 2015. PMID: 26696552 Free PMC article.
Cited by
-
Noncanonical PD-1/PD-L1 Axis in Relation to the Efficacy of Anti-PD Therapy.Front Immunol. 2022 May 18;13:910704. doi: 10.3389/fimmu.2022.910704. eCollection 2022. Front Immunol. 2022. PMID: 35663968 Free PMC article. Review.
-
The many faces of the anti-COVID immune response.J Exp Med. 2020 Jun 1;217(6):e20200678. doi: 10.1084/jem.20200678. J Exp Med. 2020. PMID: 32353870 Free PMC article.
-
Suppression of Cytotoxic T Cell Functions and Decreased Levels of Tissue-Resident Memory T Cells during H5N1 Infection.J Virol. 2020 Apr 16;94(9):e00057-20. doi: 10.1128/JVI.00057-20. Print 2020 Apr 16. J Virol. 2020. PMID: 32075925 Free PMC article.
-
Modulatory effects of gut microbiome in cancer immunotherapy: A novel paradigm for blockade of immune checkpoint inhibitors.Cancer Med. 2021 Feb;10(3):1141-1154. doi: 10.1002/cam4.3694. Epub 2020 Dec 25. Cancer Med. 2021. PMID: 33369247 Free PMC article. Review.
-
Identification of Neutrophil-Related Factor LCN2 for Predicting Severity of Patients With Influenza A Virus and SARS-CoV-2 Infection.Front Microbiol. 2022 Apr 12;13:854172. doi: 10.3389/fmicb.2022.854172. eCollection 2022. Front Microbiol. 2022. PMID: 35495713 Free PMC article.
References
-
- Brown JA, Dorfman DM, Ma F-R, et al. Blockade of programmed death-1 ligands on dendritic cells enhances T cell activation and cytokine production. Journal of Immunology. 2003;170(3):1257–1266. - PubMed
-
- Carter L, Fouser LA, Jussif J, et al. PD-1:PD-L inhibitory pathway affects both CD4+ and CD8+ T cells and is overcome by IL-2. European Journal of Immunology. 2002;32(3):634–643. - PubMed
Publication types
MeSH terms
Substances
LinkOut - more resources
Full Text Sources
Other Literature Sources
Medical
Molecular Biology Databases
Research Materials
